
Overfitting vs Underfitting: Read the Gap Between Training and New Data
Your model just aced its training data. Ninety-eight percent accuracy. Beautiful curves. Then you hand it new examples, and it stumbles like it never saw…

Key topics
Your model just aced its training data. Ninety-eight percent accuracy. Beautiful curves. Then you hand it new examples, and it stumbles like it never saw the problem before.
This is the most common frustration in classical machine learning, and it is not a mystery. It is a signal. The gap between how a model performs on data it has seen and data it has not seen is your first clue about what went wrong. Learn to read that gap, and you will stop guessing at fixes and start running the right experiment.
Why a Great Training Score Can Still Be a Bad Model
Here is the trap: a model that scores brilliantly on training data feels like proof that you built something good. It is not proof. It is only proof that the model learned the training data.
The real job of a model is to predict data it has never seen. That ability has a name: generalization. A model that memorizes its training examples but fails on new ones has not generalized. It has just performed well in rehearsal and badly on stage.
So how do you know which one you have? You compare two numbers:
- Training error: how wrong the model is on the data it learned from.
- Validation error: how wrong the model is on data it never saw during training.
That second number is the one that matters most. To get it, you need a validation set—a slice of data you set aside before training and never let the model peek at. If you have not done this yet, stop here and set up your train/validation/test split first. Everything in this article depends on having that information boundary in place.
Once you have both numbers, the pattern they form points you toward a failure mode. There are two classic signatures, and they look almost like opposites.
Knowledge check
Check your understanding
Answer this question before you continue.
Underfitting: The Model Is Too Simple to See the Pattern
Underfitting happens when your model performs poorly on both training data and validation data. The two error numbers sit high, and they sit close together.
The mechanism is simple: the model does not have enough capacity to capture the relationship between your inputs and your target. It is like trying to fit a straight line through data that curves. No matter how you angle that line, it will miss. The model is not confused. It is under-equipped.
A classic example: you try to predict rainfall using only temperature. Temperature alone cannot carry the pattern—humidity, wind, and pressure all matter. Your model does badly on training data because the features you gave it are not expressive enough to describe what is happening.
Common causes of underfitting:
- Too few features.
- A model family that is too simple for the shape of the data.
- Too much regularization, which actively suppresses the model's flexibility.
- Not enough training time.
The technical term for this failure is high bias. Bias here does not mean prejudice. It means the model carries a built-in assumption that oversimplifies the data. The model assumes a straight line will do, or that one feature is enough, and that assumption drags error up everywhere.
The signature to remember: high error on training, high error on validation, small gap between them.
Knowledge check
Check your understanding
Answer this question before you continue.
Overfitting: The Model Memorizes Noise Instead of Learning the Pattern
Overfitting is the opposite failure, and it is sneakier because the training numbers look fantastic.
Here is the signature: training error drops near zero, but validation error stays high or even rises. The gap between the two is wide. Your model crushed the data it saw, then failed on data it did not.
The mechanism is memorization. A flexible model has enough freedom to fit not just the real pattern in your data, but also the random noise, outliers, and quirks that happen to be in your training set. It learns the signal and the static. When new data arrives, the static is gone, and the model does not know what to do.
Think of a high-degree polynomial. Give it enough terms and it will wiggle through every single training point, producing a curve that looks like a seismograph during an earthquake. It fits the training data perfectly. Then you show it a new point, and the wiggle sends the prediction somewhere absurd.
Common causes of overfitting:
- Too many features.
- A very flexible model family.
- Too little training data.
- No regularization to keep the model in check.
The technical term here is high variance. Variance means the model changes a lot when the training data changes. Train it on one sample and you get one wild curve. Train it on another sample and you get a completely different wild curve. The model is over-adapting to whatever it happens to see.
The signature to remember: very low error on training, high error on validation, wide gap between them.
Knowledge check
Check your understanding
Answer this question before you continue.
The Bias-Variance Tradeoff: Why the Middle Is the Goal
Underfitting and overfitting are not two unrelated bugs. They are two ends of one spectrum, and the dial is model complexity.
Turn the dial down and you get a simple model with high bias. It assumes too much, misses real patterns, and underfits. Turn the dial up and you get a flexible model with high variance. It reacts to everything, chases noise, and overfits. Somewhere in the middle sits a model complex enough to capture the real pattern but not so flexible that it memorizes random quirks.
This is the bias-variance tradeoff, and it is the central balancing act of classical machine learning. You are always trading one kind of error against the other.
If you plotted validation error against model complexity, you would see a curve that falls as the model gets better at capturing the real pattern, then rises again as the model starts chasing noise. The sweet spot is the bottom of that curve.
Here is the part beginners often resist: there is no fixed rule for where that sweet spot lives. The right complexity depends on your data, your features, and your task. What works for one dataset will overfit or underfit another. That is why you need a diagnostic tool instead of a formula.
Knowledge check
Check your understanding
Answer this question before you continue.
Validation Curves: Your Diagnostic Tool for Reading the Gap
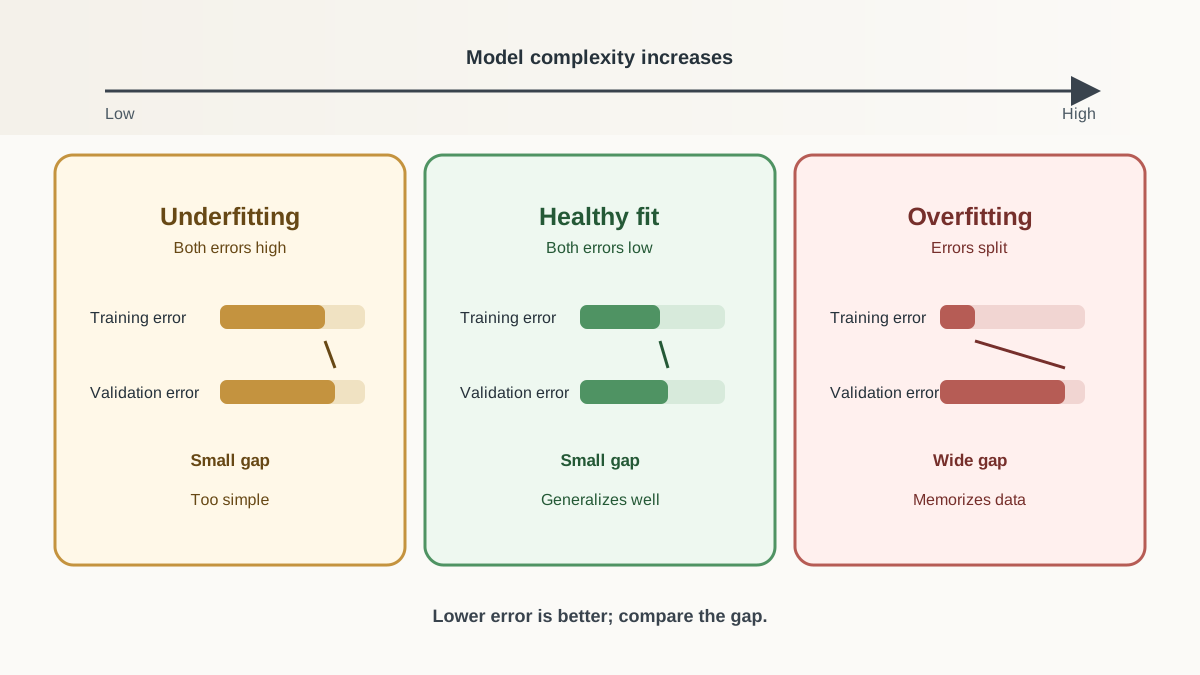
A validation curve plots training error and validation error against model complexity. It turns the gap into something you can see at a glance.
Read the plot by asking two questions: How high are the curves? How far apart are they?
Three signatures to recognize:
Underfitting: Both curves are high and flat, sitting close together. The model has plateaued at a bad level, and more complexity will not help because the model cannot capture the pattern.
Overfitting: The training curve sits very low while the validation curve stays high or starts rising. The two curves diverge like a split road. The model has memorized the training data and lost the ability to generalize.
Healthy fit: Both curves are low and close together. The model has captured the real pattern without chasing noise. There is still a small gap—that is normal and expected. A model will always do slightly better on data it has seen.
Two related plots answer different questions. A curve over training iterations shows whether the model still has room to learn or has started to overfit with more passes. A curve over training-set size shows whether more data would shrink the gap. For now, the complexity curve is the one that matches the bias-variance story.
One warning: do not over-read tiny differences. Some gap between training and validation error is not a crisis. It is the natural cost of learning from a finite sample. You are looking for patterns, not perfection.
Before You Trust the Diagnosis: Check the Measurement
The training-versus-validation pattern is your first clue, but it is not the whole diagnosis. A wide gap or a high error level can also come from a broken measurement setup. Before you change model capacity, run through three quick checks.
Check the split. Is your validation data drawn from the same process as your training data? If your validation set comes from a different time period, location, or source than your training data, the gap may reflect a distribution mismatch rather than overfitting. Skim a few validation examples and ask whether they look like examples the model should reasonably encounter.
Check the metric. Does your error metric match your task? Using the wrong metric can make a perfectly reasonable model look broken. If your numbers seem confusing, confirm that you are measuring the same quantity on both training and validation data.
Check for leakage. Did any preprocessing step—scaling, imputation, feature selection—see the validation data before training? If so, your validation error is optimistic, and the gap you are reading is unreliable. Preprocessing must be learned on training data only.
These checks are quick. Skipping them can send you chasing a complexity fix when the real problem is in the measurement.
What to Do Next: Choosing the Principled Experiment
Once you have confirmed the measurement and named the signature, the next step stops being guesswork. Each failure mode points to a specific family of experiments.
If you see underfitting—both errors high and close together—you need more model capacity:
- Add features that carry real information about the target.
- Switch to a more flexible model family.
- Reduce regularization.
- Train longer.
If you see overfitting—training error low, validation error high, wide gap—you need to restrain the model:
- Simplify the model.
- Add regularization, which is a penalty that trades flexibility for stability.
- Gather more training data.
- Reduce the number of features.
Regularization deserves special attention because it is the most precise tool in this list. It is a dial you can turn continuously: a little more regularization makes the model calmer, a little less lets it stretch. You do not need to know the math of specific techniques yet. Just understand the role: regularization is how you tell a flexible model to stop overreacting to noise.
Treat these as experiments, not one-time fixes. Change one thing, retrain, and look at the validation curve again. Did the gap narrow? Did both errors drop? The curve will tell you whether your experiment worked.
Here is a concrete next step you can run today: train one deliberately simple model and one deliberately complex model on the same data. Plot their validation curves side by side. You will almost certainly see the underfitting signature on one and the overfitting signature on the other. That contrast is the fastest way to make these two failure modes visceral.
Make Diagnosis a Habit
Before you tune anything, before you add features or change algorithms, plot training and validation error and name the signature you see. Underfitting, overfitting, or healthy fit. That one habit will save you more hours than any optimization trick you will learn later.
The model that aces training data and fails on new data is not broken. It is telling you something precise about its own flexibility and the data you gave it. Learn to read the gap, and every poor result becomes a diagnosis instead of a disappointment.
Knowledge check
Final check
Finish the article by checking the ideas you just learned.
References
Research updated Sep 8, 2026


