
Residual Analysis for Regression: Find Structure Left in the Errors
A regression model reports a solid R-squared, so you call it done. Then you plot the predictions against the actual values and notice something…

Key topics
A regression model reports a solid R-squared, so you call it done. Then you plot the predictions against the actual values and notice something uncomfortable: the model misses low values high and high values low, or the errors grow wilder as predictions climb. The score said "fine." The residuals say otherwise.
That gap is the beginner trap. A single metric compresses every prediction error into one number, and in doing so, it averages away the most interesting information you have: where and why your model goes wrong. Residual analysis is how you recover that information.
Why a Good Score Can Still Hide a Broken Model
Imagine summarizing a movie by its average rating. A 7.4 tells you something, but it hides whether the film was consistently decent or half brilliant and half unwatchable. Regression metrics work the same way. RMSE and R-squared tell you how wrong your model is on average. They do not tell you whether the errors are scattered randomly or piled up in one region of your data.
Residuals are the leftover signal your model failed to explain. If you fit a line through data that curves, the line will miss in a systematic way: too high in some places, too low in others. Those misses are not random noise. They are structure your model left on the table.
The core diagnostic habit is simple: after fitting a regression model, plot the residuals and look for pattern. Random scatter around zero is the healthy sign. Structure is a clue that something is missing.
What a Residual Actually Is
A residual is the difference between what you observed and what your model predicted:
residual = observed value − predicted value
Suppose you fit a model predicting house prices and it predicts $300,000 for a house that actually sold for $320,000. The residual is +$20,000. The model under-predicted. If the house sold for $285,000, the residual is −$15,000. The model over-predicted.
Each data point has one residual. Positive means the model guessed low. Negative means it guessed high.
One quirk catches beginners off guard: for an ordinary least-squares fit, residuals always balance out around zero. The sum of residuals is essentially zero by construction. That means the average residual tells you almost nothing. A flat average is not evidence of a good model—it is a mathematical guarantee.
The useful information lives in the pattern of residuals across your predictions or features. That is why you plot them.
A residual plot puts residuals on the vertical axis and something else on the horizontal axis—usually the predicted values or a single feature. Each point on the plot is one observation's error. The shape of the cloud of points is the story.
Knowledge check
Check your understanding
Answer this question before you continue.
Reading the Four Classic Residual Patterns
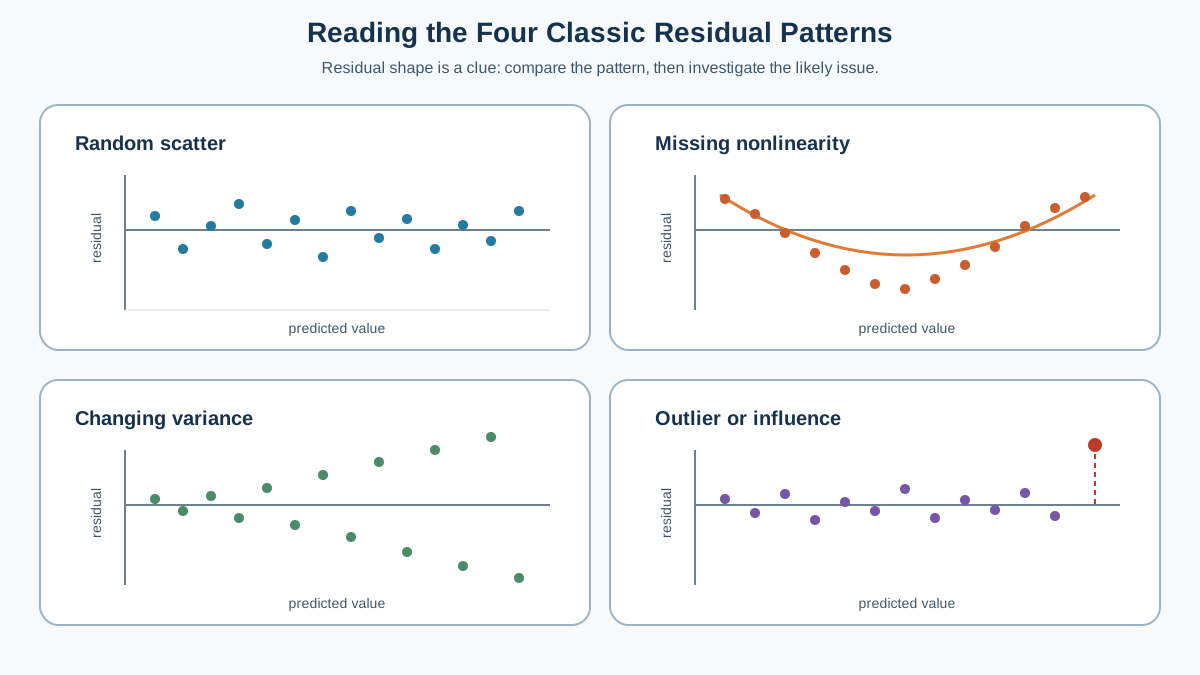
When you look at a residual plot, you are looking for one of four shapes. Each shape points to a different problem and a different next step.
Random scatter: no obvious structure left
If residuals scatter randomly around the zero line with no discernible trend and roughly consistent spread, your model has captured the main structure in the data. The remaining error looks like noise.
Read this as a diagnostic observation, not a final verdict. Random scatter means no obvious systematic pattern is visible in this plot, for this sample. It does not prove the model generalizes to new data, and it does not prove every assumption holds. A model can show a clean residual cloud on training data and still fail badly on unseen examples. The healthy sign is a green light to keep checking, not a certificate of completion.
A curve or U-shape: missing nonlinearity
If residuals bend into a curve—dipping below zero at one end, rising above it in the middle, dipping again—your model is missing a nonlinear relationship. A straight line cannot follow a curve, so it systematically misses in predictable places.
The fix is to give the model more expressive power: add a polynomial term, transform a predictor (a log transform often tames exponential relationships), or consider a nonlinear model. The residual plot tells you that the relationship is curved. It does not tell you the exact form, so treat the pattern as a hypothesis to test rather than a prescription.
Knowledge check
Check your understanding
Answer this question before you continue.
A funnel shape: changing variance
If residuals fan out as predictions grow—narrow at one end, wide at the other—the variance of your errors is not constant. Statisticians call this heteroscedasticity. In plain terms: your model's predictions are more reliable in some regions than others.
Before reaching for a fix, ask what the changing spread actually harms. If you mainly care about point predictions, a funnel may be tolerable. If you care about uncertainty—confidence intervals, risk calculations, or decision boundaries—the uneven spread matters, because the error bars are not the same size everywhere.
If the spread itself is the problem, your options depend on your goal. Weighting observations or transforming the target can stabilize variance. Quantile regression is a different kind of choice: use it when you want to model conditional ranges directly—say, the 10th and 90th percentiles of house prices—rather than just the center. It is not the default repair for a funnel; it is the right tool when your question is about spread, not just the middle.
Knowledge check
Check your understanding
Answer this question before you continue.
Isolated far points: outliers and influence
A few points floating far from the pack deserve attention. One extreme point can quietly bend an entire fitted line toward itself, distorting predictions across the whole range.
Before you do anything, investigate. Is the point a data-entry error? A real but rare extreme case? A different population that should not be in the dataset? The answer determines the action. Removing an outlier without understanding what it represents is how you build a model that works on cleaned data and fails in production.
Common mistake: Treating every outlier as something to delete. An outlier is a question, not a verdict. Inspect it first.
Residuals Against Features vs. Against Predictions
Beginners often do not know which axis to plot. The choice matters because the two plots answer different questions.
Residuals versus predicted values is the general-purpose check. It reveals overall fit problems and changing variance in one view. Start here.
Residuals versus a single feature answers a narrower question: is this feature's relationship mis-specified? If you suspect house price depends on square footage nonlinearly, plot residuals against square footage. A curve in that plot means the model flattened a relationship that was not straight.
The practical payoff: a pattern against one feature but not another tells you where the missing structure lives. That is far more useful than knowing only that something is wrong.
My rule: start with residuals versus predictions, then drill into specific features when you suspect a missing relationship.
Knowledge check
Check your understanding
Answer this question before you continue.
From Pattern to Next Step: A Small Decision Guide
Residual analysis is evidence gathering, not a recipe. The plot tells you what to investigate, not the guaranteed fix. Here is how to translate what you see into a justified next experiment:
| Pattern you see | What it suggests | Next step to try |
|---|---|---|
| Random scatter | No obvious systematic structure in this view | Check residuals on held-out or out-of-fold predictions, then evaluate generalization |
| Curve or U-shape | Missing nonlinear relationship | Add polynomial or interaction terms, transform a predictor, or try a nonlinear model |
| Funnel shape | Variance is not constant | Decide whether spread or uncertainty matters; consider weighting, a target transform, or quantile regression if you need conditional ranges |
| Isolated far points | Possible outliers or influential points | Inspect the points before deciding to remove or keep them |
One boundary is worth stating plainly. Residual plots are a useful error view for any regression model, including tree-based ensembles. But the classic interpretations above—missing linearity, non-constant variance, assumption violations—are strongest for linear-model workflows where those assumptions are explicit. When you plot residuals from a random forest or gradient boosting model, a pattern is evidence that something systematic remains, but it does not point to a specific violated assumption the way it does for a linear fit. Treat the pattern as a lead to investigate, not a precise diagnosis.
Common Beginner Mistakes in Residual Analysis
Residual reading looks easy until you misread it. These mistakes trip up nearly everyone at some point:
Reading too much into a small sample. With only a dozen points, apparent patterns can be pure noise. Gather enough data before trusting a shape.
Forgetting residuals come from training data. Healthy-looking residuals on the data you trained on do not prove the model generalizes. A model can fit training data beautifully and fail on new data. Make the check part of your workflow: first inspect residuals on training data to understand fit structure, then inspect residuals from validation or out-of-fold predictions to see whether the pattern survives on unseen data.
Deleting outliers without investigation. Every outlier is a story. Read it before you erase it.
Reaching for a more complex model too quickly. A residual pattern sometimes means a missing feature or a bad data point, not a need for a fancier algorithm. The cheapest fix is often the right one.
Assuming residual analysis only applies to linear regression. The habit of plotting errors transfers to any regression model. The specific patterns may mean different things, but the core instinct—treat errors as evidence—is universal.
The Habit That Separates Good Models from Lucky Ones
After you read a residual plot, name the pattern you see. State the hypothesis it suggests. Then run one targeted experiment: add a feature, transform a variable, inspect an outlier, or check held-out error.
Residual analysis is not a one-time cleanup step. It is a habit of treating errors as evidence rather than noise to ignore. The score tells you how wrong you are. The residuals tell you why—and once you know why, you can actually fix it.
When your residuals finally look like random scatter, the model is not necessarily finished. It is ready for the next test: how it behaves on data it has never seen. That is where learning curves and held-out evaluation take over. But you will get there with far more confidence when you know the errors you are generalizing are noise, not hidden structure.
Knowledge check
Final check
Finish the article by checking the ideas you just learned.
References
Research updated Sep 8, 2026


