
Machine Learning Evaluation Metrics: Choose the Score That Matches the Cost
A model that scores 90% accurate can still fail at the exact job it was built for. The headline number looks impressive, but it may be hiding a model that…

Key topics
A model that scores 90% accurate can still fail at the exact job it was built for. The headline number looks impressive, but it may be hiding a model that never catches the cases that actually matter. Evaluation is not about finding the highest score. It is about finding the score that measures what your mistakes cost you.
Why Accuracy Is a Trap for Beginners
Accuracy sounds fair. It counts how many predictions your model got right out of everything it predicted. If your model is correct 90 times out of 100, that feels like a solid result.
The problem appears when one class dominates your data. Imagine you are building a model to flag fraudulent credit card transactions. In a typical dataset, maybe 90% of transactions are legitimate and only 10% are fraudulent. Now imagine a model that simply predicts "not fraudulent" for every single transaction. It will be correct 90% of the time. By accuracy, that model looks great.
But it caught zero fraud. The one job you built it for, it never does.
This is the accuracy trap. When one outcome is much rarer than the other, a lazy model can earn a high accuracy score by always predicting the majority class. The score says "good work." The real-world result says "useless."
The question you should ask is not "how often am I right?" It is "which mistakes hurt, and how much?"
To answer that, you need to see where your model's errors actually land. That is what the confusion matrix shows you.
A confusion matrix is a simple table that compares what your model predicted against what actually happened. For a two-class problem, it has four boxes:
- True positives: You predicted "yes," and the answer was yes.
- True negatives: You predicted "no," and the answer was no.
- False positives: You predicted "yes," but the answer was no.
- False negatives: You predicted "no," but the answer was yes.
Many threshold-based classification metrics are built from these four counts. Once you can look at a confusion matrix and see where the errors fall, you can stop trusting a single accuracy number and start asking which errors you can afford.
Knowledge check
Check your understanding
Answer this question before you continue.
Name the Cost of Each Mistake First
Here is the decision rule that organizes everything else in this article: choose your metric based on which mistake costs you more.
Two scenarios make this concrete.
Scenario one: spam filtering. Your model decides whether an email goes to the inbox or the spam folder. A false positive means a real email from a client got buried in spam. A false negative means a spam message slipped into the inbox. Both are annoying, but most people would rather delete one spam email than miss an important message. The false positive is the expensive mistake.
Scenario two: disease screening. Your model flags patients who may need further testing. A false negative means a sick patient is told they are fine and goes home untreated. A false positive means a healthy patient gets an unnecessary follow-up test. Here the false negative is the dangerous mistake. Missing the disease is far worse than a little extra testing.
Same structure, opposite costs. In the spam case, you want a model that rarely cries wolf. In the screening case, you want a model that rarely misses a wolf.
The metrics you are about to learn exist because accuracy cannot tell these two scenarios apart. Precision and recall can, because each one focuses on a different kind of mistake.
Knowledge check
Check your understanding
Answer this question before you continue.
Precision, Recall, and F1: Metrics That Respect the Cost
Precision answers this question: when the model says "yes," how often is it right?
Precision is the metric for problems where false positives are the expensive mistake. In the spam example, high precision means that when an email lands in the spam folder, you can trust that decision. The model is not burying your legitimate mail.
Recall answers a different question: of all the real "yes" cases out there, how many did the model catch?
Recall is the metric for problems where false negatives are the expensive mistake. In the disease screening example, high recall means the model rarely sends a sick patient home. It might flag some healthy people for extra tests, but it is not missing the disease.
F1 score combines precision and recall into a single number. It is useful when both kinds of mistakes matter roughly equally and you need one score to compare models.
Here is the catch: precision and recall usually trade off against each other. Push the model to catch more real cases, and you will probably also flag more false alarms. Push the model to avoid false alarms, and you will probably miss some real cases. F1 gives you a balanced view of both.
| Metric | Question it answers | Use it when | Skip it when |
|---|---|---|---|
| Precision | When the model says yes, is it right? | False positives are costly | Missing real cases is the danger |
| Recall | Of the real yes cases, how many did we catch? | False negatives are costly | False alarms are the bigger problem |
| F1 | Balanced view of precision and recall | Both errors matter similarly | One error clearly dominates the cost |
A quick example shows why the same model can look very different under each lens. Suppose you build a fraud detector on data where 100 transactions are fraudulent and 900 are legitimate. The model flags 80 transactions as fraudulent. Of those 80, 60 really are fraud, and 20 are false alarms. It also misses 40 fraudulent transactions entirely.
Accuracy says the model is right 940 times out of 1000: 94%. But precision is 60 out of 80, or 75%. Recall is 60 out of 100, or 60%. The model catches most fraud it flags, but it still misses 40% of actual fraud. Which number matters depends entirely on what a missed fraud case costs you.
Common mistake: Treating F1 as always better than precision or recall. F1 is a compromise. If one error type is clearly more expensive, optimize for the metric that matches that cost instead of splitting the difference.
Knowledge check
Check your understanding
Answer this question before you continue.
Scores, Thresholds, and ROC AUC: When You Care About Ranking
So far, we have talked about models that output a hard label: yes or no, fraud or not fraud. But most classifiers actually output a score that ranks how likely each case is to be positive. The model might say a transaction has a 72% chance of being fraudulent. You then choose a threshold: flag anything above 50%, or 70%, or 90%. That threshold is what turns the score into the yes-or-no labels you plug into a confusion matrix.
Change the threshold, and precision and recall both change. A low threshold catches more fraud but also generates more false alarms. A high threshold does the opposite.
ROC AUC measures something different. It asks: if you ranked every case from most likely to least likely to be positive, how well would the model separate the real positives from the real negatives? It summarizes that separation across every possible threshold at once, rather than committing to one cutoff.
The intuition is simple. A random model that just guesses scores 0.5. A perfect model that ranks every positive above every negative scores 1.0. The closer your model gets to 1.0, the better it separates the classes.
ROC AUC is a useful broad comparison signal when you want to know whether one model ranks cases better than another. But it has limits. It does not tell you which threshold to use. And a model with excellent AUC can still perform badly at the specific threshold you choose.
Note: ROC AUC is not accuracy, and it is not a promise about your operating range. A model can have high AUC and still make many wrong predictions at the threshold you actually use. Use AUC to compare how well models rank cases overall, then use precision and recall to judge the labels they produce at your chosen cutoff.
If your real task is a review queue—say, a fraud team investigating the top 100 most suspicious transactions—judge the model on how well it performs in that region of the ranking, not on a global summary. ROC AUC can tell you the model separates classes well in general. It does not guarantee that the top of your list is where the fraud lives.
Knowledge check
Check your understanding
Answer this question before you continue.
Regression Metrics: Measure the Error, Not the Label
Classification problems have right and wrong answers. Regression problems have distance. When you predict a house price of $310,000 and the real price is $300,000, you are not wrong in the classification sense. You are off by $10,000. Regression metrics measure that distance.
Mean Absolute Error (MAE) is the average distance between your predictions and the real values. If your house price predictions are off by $10,000, $5,000, and $15,000, the MAE is $10,000. It treats every error equally and is easy to interpret because it is in the same units as your target.
Mean Squared Error (MSE) and its cousin Root Mean Squared Error (RMSE) square the errors before averaging them. Squaring makes large errors hurt disproportionately. An error of $50,000 counts 25 times more than an error of $10,000, not 5 times more.
That sounds harsh, and it is meant to be. As a first choice, use RMSE when large mistakes are the dangerous ones. If you are forecasting inventory and a small error just means a minor adjustment, but a large error means empty shelves or wasted stock, you want a metric that punishes big misses hard. Just remember that the final decision should also include inspecting errors in target units and checking whether a few outliers are dominating the score.
R-squared asks a different question: how much better is your model than just predicting the average value every time? An R-squared of 0.9 means your model explains most of the variability in the data. An R-squared near 0 means your model is barely better than predicting the mean. Treat R-squared as a companion comparison against that mean baseline, not as a replacement for MAE or RMSE when you need error in plain target units.
| Metric | What it measures | Use it when | Skip it when |
|---|---|---|---|
| MAE | Average error in target units | All errors matter equally and you want easy interpretation | Large errors are disproportionately dangerous |
| RMSE | Error with large misses heavily penalized | Big mistakes are the costly ones | You need a metric in plain target units |
| R-squared | Improvement over predicting the mean | You want to know how much variance the model explains | You need an absolute error measurement |
The MAE vs RMSE choice comes down to one question: does a big miss hurt more than proportionally? If yes, use RMSE. If every dollar of error costs the same, use MAE.
A Decision Rule for Picking Your Metric
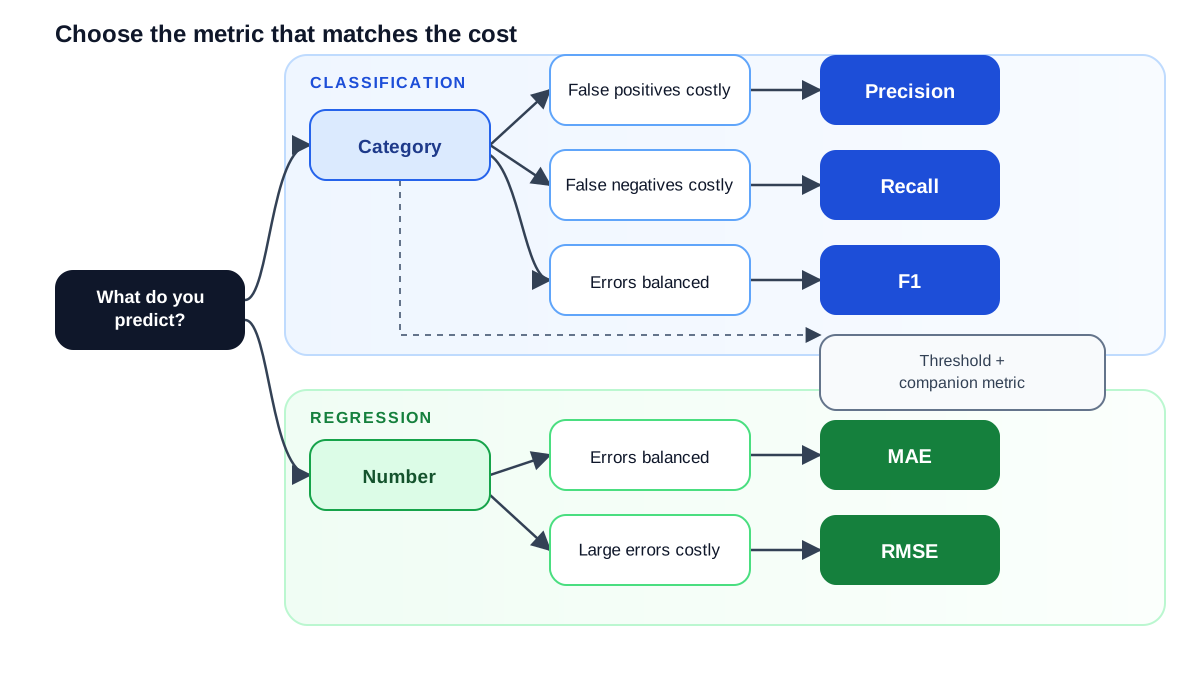
You now have the pieces. Here is how to put them together for any new problem.
Step 1: Is the output a category or a number? If the model predicts a class like fraud or not fraud, you are in classification territory. If it predicts a continuous value like price or temperature, you are in regression territory.
Step 2: For classification, which error costs more? If false positives are expensive, make precision your primary metric. If false negatives are expensive, make recall your primary metric. If both matter about equally, use F1.
Step 3: Choose the threshold that meets your constraint. Your metric is a target, not a switch. If you need at least 90% recall, find the threshold that achieves it, then measure the precision you get at that threshold. The companion metric tells you what you are trading away.
Step 4: For regression, are large errors disproportionately harmful? As a first choice, use MAE when every error costs the same and RMSE when big misses are the dangerous ones. Add R-squared when you want to know how much better you are than a naive baseline.
One more rule: no single number tells the whole story. Pick the metric that encodes your most expensive mistake, then report one or two companions alongside it. A fraud model might be judged on recall, but you still want to know its precision so you understand how many false alarms you are handling.
And remember where these metrics belong. A model can memorize its training data and look perfect on the examples it has already seen. Evaluation only means something when you measure on data the model has not encountered before. That is why you hold out a test set and report your metrics there.
The next natural step is learning to read the gap between training performance and test performance. That gap is where overfitting and underfitting reveal themselves—and it will tell you whether your model's score is real skill or just memorization.
Knowledge check
Final check
Finish the article by checking the ideas you just learned.
References
Research updated Sep 8, 2026


