
Test a Feature Engineering Idea With a Leakage-Safe Experiment
A feature idea is a hypothesis. Change one thing, measure the same way twice, and let the output decide.

Key topics
A feature idea is a hypothesis. Change one thing, measure the same way twice, and let the output decide.
You add a ratio column, rerun your pipeline, and the validation score ticks up. You ship it. Two weeks later the gain is gone, and you cannot explain why. I have watched this loop repeat in my own projects often enough to stop trusting any single score bump. The problem is almost never the feature. It is the experiment around it.
This tutorial assumes you already know how to build a preprocessing-plus-estimator pipeline and hold out a test set. Here we only add the discipline of a controlled comparison: one feature, one baseline, one validation procedure, one honest verdict.
Why Most Feature Experiments Lie to You
A score bump feels like proof. Usually it is one of four confounds.
- You changed more than one thing. A new feature plus a new scaler plus a different seed is not a feature experiment. It is three experiments wearing one coat.
- You fit a learned transform on all the data. If your scaler, imputer, or target statistic saw validation or test rows during fitting, the gain will not survive production. This is the sharpest version of the problem: a leakage-safe feature transformation fits only on training folds.
- You compared scores from different splits or seeds. Two independent runs differ for reasons that have nothing to do with your feature.
- You read a difference smaller than the noise. A mean gain of 0.01 with fold-to-fold swings of 0.05 is not evidence. It is weather.
Leakage deserves its own warning because it is the failure that looks most like success. A transform that learns from held-out rows produces a beautiful number that evaporates the moment real data arrives.
Common mistake: Fitting a scaler, imputer, or target encoder on the full frame before splitting, then passing the result into cross-validation. The transform has already absorbed statistics from the rows it will be scored on.
Notice what is not on that list. A row-wise calculation like cost / size uses no fitted statistics and no labels. If both columns are available at prediction time, you can compute that ratio before splitting without leaking anything — the value for a given row depends only on that row. The leakage boundary is not "did I touch the data before splitting." It is "did this operation learn from held-out rows, or use information that will not exist at prediction time." Keep that distinction sharp; it decides which transforms must live inside the pipeline and which are just arithmetic.
So before running anything, write down your success criteria: the metric, the validation procedure, and the decision rule for what counts as a real improvement. A feature idea is a hypothesis with a predicted effect, not a change you make and then rationalize.
Knowledge check
Check your understanding
Answer this question before you continue.
Set Up the Experiment: One Feature, One Baseline
You need Python with scikit-learn, NumPy, and pandas, plus a small tabular dataset with a numeric target or binary label. No credentials, no external services. I will use a synthetic frame so the numbers are reproducible, but the structure applies to any tabular problem.
Pick a feature idea with a stated mechanism. Suppose you believe that the ratio of two numeric columns carries signal that neither column carries alone — a rate, a density, a per-unit cost. Write that prediction down. "I expect the ratio to help because the target depends on efficiency, not raw size."
Now express the idea as a transformer inside the pipeline, so fitting happens only on training folds and the same code runs at prediction time.
import numpy as np
import pandas as pd
from sklearn.pipeline import Pipeline
from sklearn.preprocessing import StandardScaler, FunctionTransformer
from sklearn.linear_model import Ridge
from sklearn.model_selection import KFold, cross_val_score

rng = np.random.default_rng(0)
n = 400
X = pd.DataFrame({
    "size": rng.uniform(1, 10, n),
    "cost": rng.uniform(1, 10, n),
})
y = 3 * (X["cost"] / X["size"]) + rng.normal(0, 0.5, n)

def add_ratio(frame):
    frame = frame.copy()
    frame["cost_per_size"] = frame["cost"] / frame["size"]
    return frame

baseline = Pipeline([
    ("scale", StandardScaler()),
    ("model", Ridge(alpha=1.0)),
])

candidate = Pipeline([
    ("ratio", FunctionTransformer(add_ratio)),
    ("scale", StandardScaler()),
    ("model", Ridge(alpha=1.0)),
])
Everything else stays identical: same estimator, same hyperparameters, same seed, same preprocessing. The only difference is the ratio step. That is the whole point — if two things differ, you learn nothing about either.
Note:
FunctionTransformerruns insidefitandtransform, so the ratio is computed per fold. The scaler then sees only training-fold statistics. That is what makes this a leakage-safe feature transformation rather than a hopeful one.
Knowledge check
Check your understanding
Answer this question before you continue.
Run the Comparison and Read the Output
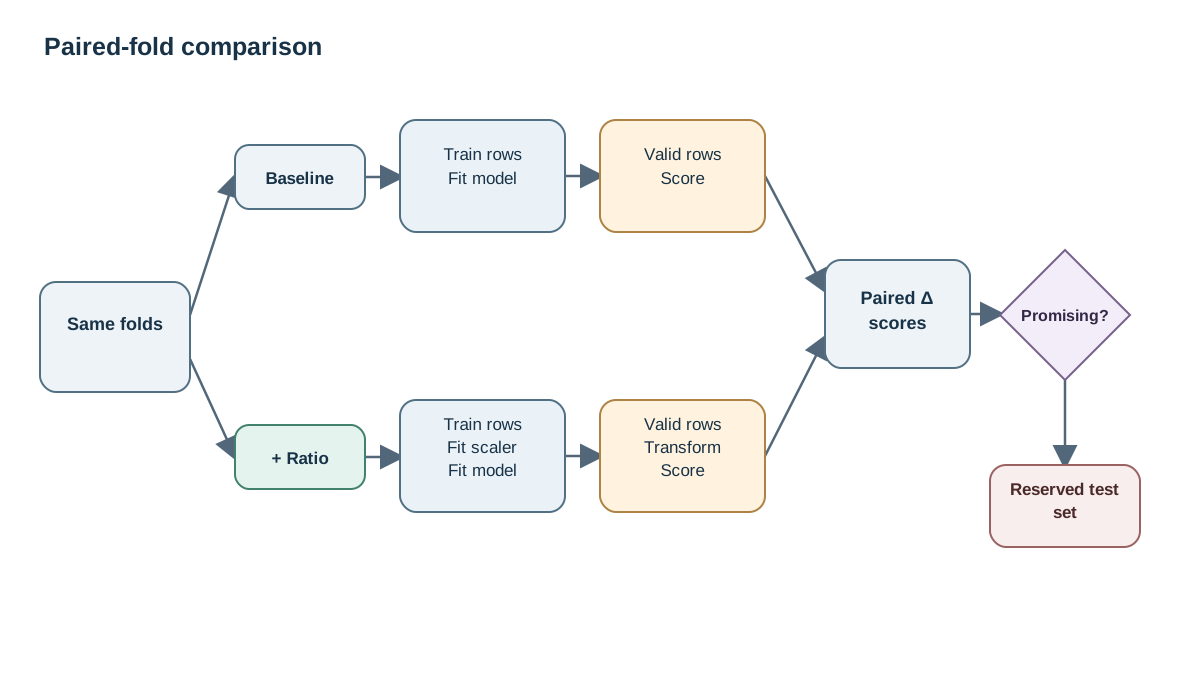
Use the same cross-validation splitter and seed for both pipelines. Paired folds are far less noisy than two independent runs, because each fold compares baseline and candidate on the same rows.
cv = KFold(n_splits=5, shuffle=True, random_state=42)

base_scores = cross_val_score(baseline, X, y, cv=cv, scoring="r2")
cand_scores = cross_val_score(candidate, X, y, cv=cv, scoring="r2")

for i, (b, c) in enumerate(zip(base_scores, cand_scores)):
    print(f"fold {i}  baseline={b:.3f}  candidate={c:.3f}  delta={c - b:+.3f}")

print(f"mean delta: {(cand_scores - base_scores).mean():+.3f}")
print(f"delta spread: {(cand_scores - base_scores).std():.3f}")
Expected output shape:
| fold | baseline | candidate | delta |
|---|---|---|---|
| 0 | 0.71 | 0.98 | +0.27 |
| 1 | 0.69 | 0.97 | +0.28 |
| 2 | 0.72 | 0.98 | +0.26 |
| 3 | 0.70 | 0.97 | +0.27 |
| 4 | 0.68 | 0.98 | +0.30 |
The interpretation rule is simple. A consistent sign across folds with a delta larger than the fold-to-fold variation is worth a second look. A single lucky fold is not. Here every fold moves in the same direction by roughly the same amount, which is a promising signal — but five related folds on one synthetic dataset are evidence, not proof. Treat the pattern as a reason to keep going, not a verdict.
Do not touch the reserved test set yet. This stage decides whether the idea deserves a final evaluation at all.
Knowledge check
Check your understanding
Answer this question before you continue.
Inspect What Actually Changed
A score is a symptom. The mechanism is what you inspect next.
Look at the coefficients before and after. Did the new feature absorb weight, or did it sit near zero while the score moved for unrelated reasons?
baseline.fit(X, y)
candidate.fit(X, y)

print("baseline coefs:", baseline.named_steps["model"].coef_)
print("candidate coefs:", candidate.named_steps["model"].coef_)
If the ratio coefficient is large and the raw size and cost coefficients shrink, the model is using the feature the way you predicted. If the ratio coefficient is near zero and the score still improved, suspect a side effect — a change in scale, sparsity, or effective regularization — rather than the signal you intended.
Then compare residuals or misclassified rows. The feature should fix a specific error pattern, not shift everything slightly. If the errors that shrank are the ones your mechanism predicted, the story holds together.
Sanity-check the transform's own distribution. A ratio with a near-zero denominator, or a log of non-positive values, produces extreme values that can dominate a linear model. Plot the new column. If it has a long tail, clip it or reconsider the transform.
Common mistake: Assuming a flat result means the feature is useless. If the model family can already represent the transform internally — a tree splitting on both inputs, or a linear model given the interaction term — a null result is expected and informative. It tells you the model already had access to that relationship.
Distinguish "the feature helped" from "the feature helped this model on this data." The second is the honest claim, and it is the one you can defend.
Knowledge check
Check your understanding
Answer this question before you continue.
Failure Modes and Debugging Signals
Each symptom points at a different cause. Read them as evidence, not dead ends.
| Signal | Likely cause | What to do |
|---|---|---|
| Suspiciously large gain | Leakage: a learned transform fitted outside the pipeline, a target-derived column, or future information | Move the transform inside the pipeline; check every column's provenance |
| Gain vanishes on a new seed or splitter | The effect was noise | Increase folds or repeat across several seeds before believing it |
| Score improves, feature importance near zero | Side effect of the transform, such as a scale or sparsity change | Inspect coefficients and the transform's distribution |
| Score gets worse | Extreme values, NaNs from the transform, or changed effective regularization | Clip, impute, or re-tune the regularization strength |
| Metric mismatch | A feature that helps ranking may not help threshold-based accuracy | Confirm the metric matches the decision the model supports |
The leakage row is the one to internalize. If a gain looks too good, it usually is. Trace where every new column came from and when it was computed.
One Follow-Up Experiment Worth Running
A single test is a data point. A follow-up tests the mechanism.
Change one dimension of the hypothesis. Try the same transform on a different model family, or test a smoothed or clipped version of the same feature. If the feature is an interaction, check whether the model already captures it when given both raw inputs — a null result there is a real finding, not a failure.
Repeat across seeds or folds to estimate the noise floor of your own comparison before declaring any effect real. Then record the result either way. A documented negative result saves the next person — often yourself — from re-running the same idea.
Decide the next action explicitly: promote to a final test-set evaluation, revise the feature, or drop it.
The Decision Rule You Keep
Change one thing. Hold the validation procedure fixed. Compare paired folds. Inspect the mechanism. Only then spend the reserved test set.
A negative result is a completed experiment, not a failure. You now know something about your data and your model that you did not know an hour ago, and that knowledge compounds the next time you face a feature idea.
Your next move: take a feature you have been meaning to test, write down its predicted mechanism, and run this exact comparison. If the paired folds agree, promote it to a final evaluation. If they disagree, you just saved yourself from shipping noise.
Knowledge check
Final check
Finish the article by checking the ideas you just learned.
References
Build stronger machine learning foundations
Use structured resources to connect theory, scikit-learn workflows, and evaluation practice.


