
Inspect Permutation Feature Importance on Held-Out Data
You fit a model, call a feature-importance attribute, and get a tidy ranked bar chart. It looks like a verdict. It is not. That chart is a measurement of…

Key topics
You fit a model, call a feature-importance attribute, and get a tidy ranked bar chart. It looks like a verdict. It is not. That chart is a measurement of one fitted model against one score on one dataset — and if you measure it on the wrong data, or read only the top bar, it will quietly lie to you.
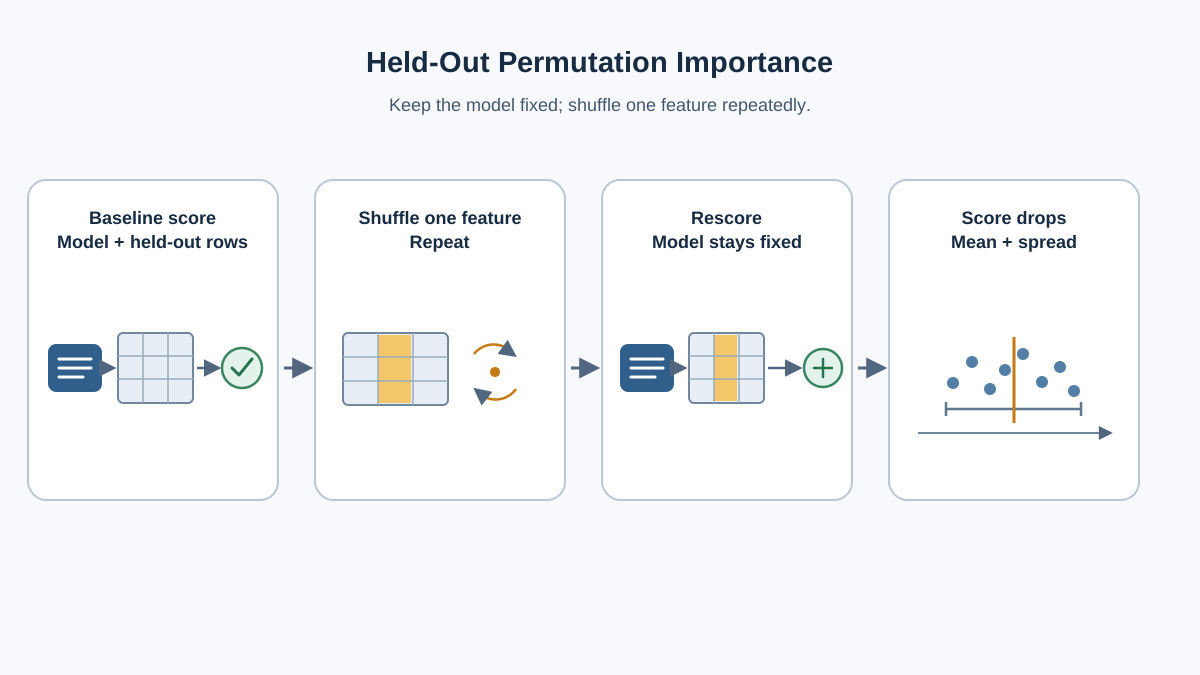
Here is the payoff we are working toward: shuffle one column, watch the held-out score fall, repeat the shuffle many times, and read the spread. That single loop is the whole technique. Everything else is learning how to keep it honest.
What Permutation Importance Actually Measures
Permutation importance is the drop in a chosen score when one feature's values are randomly shuffled while every other column stays exactly as it was. Shuffling breaks the relationship between that feature and the target. If the model leaned on the column, the score falls. If the model never used it, the score barely moves.
Two properties make this worth your time:
- It is model-agnostic. It works on any fitted estimator with tabular data, which matters most for non-linear or opaque models where coefficients do not exist.
- It is score-relative. Importance is defined against the
scoringargument you pass. A feature can matter for one metric and look irrelevant for another. Change the metric, change the ranking.
The critical framing: permutation importance describes how important a feature is for this particular model, not the intrinsic predictive value of the feature in the world. A weak model's importances describe a weak model. That is why we evaluate predictive power first, then compute importances, then interpret.
If you have already worked through coefficients and tree impurity importances, treat those as model-native views — internal to how the model was built. Permutation importance is an external probe you can apply to the same fitted model and compare against them.
Knowledge check
Check your understanding
Answer this question before you continue.
Why Held-Out Data Changes the Answer
You can permute on training data or on a held-out validation or test set. The two answer different questions.
Training-set importance rewards features the model memorized. Held-out importance highlights which features contribute to the model's generalization power — its ability to work on data it has never seen. A feature that looks important on training data but collapses on held-out data is a leakage or overfitting signal, not a discovery.
Warning: Features deemed unimportant for a bad model could be very important for a good model. Always confirm the model generalizes — held-out score clearly above chance — before computing importances. A bad model's importances describe a bad model.
The practical rule is a sequence: evaluate predictive power, then compute importances, then interpret. Skip the first step and you are ranking noise.
Knowledge check
Check your understanding
Answer this question before you continue.
Run It: A Minimal scikit-learn Experiment
Dependencies: Python with scikit-learn, NumPy, pandas, and matplotlib. No credentials, no external services.
We will use the diabetes regression dataset that ships with scikit-learn, fit a Ridge model, and probe it on held-out data.
import numpy as np
import pandas as pd
from sklearn.datasets import load_diabetes
from sklearn.model_selection import train_test_split
from sklearn.linear_model import Ridge
from sklearn.inspection import permutation_importance

diabetes = load_diabetes()
X_train, X_val, y_train, y_val = train_test_split(
    diabetes.data, diabetes.target, random_state=0
)

model = Ridge(alpha=1e-2).fit(X_train, y_train)
reference = model.score(X_val, y_val)
print(f"reference R^2: {reference:.3f}")

result = permutation_importance(
    model, X_val, y_val,
    n_repeats=30,
    random_state=0,
    scoring="r2",
)

names = np.array(diabetes.feature_names)
order = result.importances_mean.argsort()[::-1]

for i in order:
    print(f"{names[i]:<8} {result.importances_mean[i]:.3f} "
          f"+/- {result.importances_std[i]:.3f}")
Expected output is a ranked table. On this split the reference R² lands around 0.36, and the top features carry mean importances that are a meaningful fraction of that reference. That fraction is your first sanity check: if the top importances are tiny relative to the reference score, treat the ranking as weak evidence and inspect the raw score-drop distribution before drawing conclusions. A small drop can still be real and reproducible — it is just not a strong signal on its own.
Why the code behaves this way: permutation_importance reuses the fitted model and only re-scores corrupted copies of the held-out data. No retraining happens. That is what makes it cheap and what makes it a probe of this model rather than a new one.
A horizontal bar chart with error bars makes the spread visible:
import matplotlib.pyplot as plt

fig, ax = plt.subplots()
ax.barh(range(len(order)), result.importances_mean[order],
        xerr=result.importances_std[order])
ax.set_yticks(range(len(order)))
ax.set_yticklabels(names[order])
plt.tight_layout()
plt.show()
Knowledge check
Check your understanding
Answer this question before you continue.
Read the Spread, Not Just the Mean
Each shuffle is a random draw. Repeated runs give different values, which is exactly why n_repeats exists — to average over that randomness. The result object gives you importances_mean, importances_std, and the raw importances array.
A useful screening heuristic: if the mean importance is not clearly larger than its spread, treat that feature as uncertain rather than important. Overlap between the mean and the repeat-to-repeat spread is a prompt for caution, not proof of randomness. A large standard deviation means the ranking may not survive a rerun.
Instability is itself evidence. It often points to correlated features, a small held-out set, or a model that is not relying on that column consistently. Rerun with a different random_state and compare rankings. Be precise about what that rerun tests: it changes the feature shuffles on the same fitted model and the same held-out rows, so it probes permutation variability — how much the shuffle itself moves the numbers. It does not test whether the ranking would hold on a different sample or a refitted model. For that broader question you would need repeated held-out splits or refits, which is a separate and more involved check.
Knowledge check
Check your understanding
Answer this question before you continue.
Compare With a Model-Native View
Put permutation importance beside a model-native view, but treat neither as ground truth.
| View | What it measures | Data used | Model-specific? | Main bias |
|---|---|---|---|---|
| Linear coefficients | Change in output per unit of feature | Training | Yes | Meaningful only after scaling |
Tree feature_importances_ | Impurity reduction attributed to splits | Training | Yes | Biased toward high-cardinality and continuous features |
| Permutation importance | Drop in a chosen score when a column is shuffled | Held-out (your choice) | No | Misleads on correlated features |
Where the views agree, confidence rises. Where they disagree, the disagreement is the finding — investigate rather than pick the flattering chart.
Common mistake: Dropping a column and refitting produces a different model. It does not measure importance for the model you already have.
Where Permutation Importance Misleads You
Correlated features. When two columns carry overlapping information, shuffling one leaves the model access through the other. Both look less important than they are — importance gets split or hidden. A practical mitigation: cluster correlated features and permute them as a group, or keep one representative per cluster and say so explicitly.
Unrealistic shuffled rows. Permuting a single column can create combinations that could never occur — a bedroom count higher than the room count. The corrupted predictions may be meaningless rather than merely worse.
Extrapolation risk. Shuffling pushes values into regions the model never saw during training. The score drop then reflects nonsense inputs, not feature value.
Association is not causation. A high importance means the model uses the feature. It does not mean changing the feature changes the outcome.
One Experiment to Make It Stick
Add a duplicate or near-duplicate of your top feature, refit, and recompute permutation importance. Watch the importance split between the twins.
Then permute the correlated pair together as a group and compare the combined drop against the individual drops. The gap between individual and grouped importance is a direct measurement of how much information the features share.
Optional second variation: change the scoring argument and observe how the ranking shifts. This reinforces that importance is score-relative, not absolute. Record what changed and why — that habit turns a one-off chart into a repeatable diagnostic.
When to Use This and When Not To
Use it when the model is fitted and generalizes, the data is tabular, you need a model-agnostic view, or you want to compare importance across different model families on the same score.
Use it with care when features are strongly correlated, the held-out set is small, or the model is being used for causal decisions.
Do not use it as a causal claim, a feature-selection verdict on its own, or a substitute for checking whether the model is any good in the first place. Pair it with the neighboring diagnostics: learning curves for data-versus-complexity questions, residual analysis for regression structure, and calibration when the score itself is the concern.
Before you trust any importance chart, run this checklist: confirm the model generalizes, permute on held-out data, read the spread, and check for correlated twins. Then rerun the experiment with a grouped permutation or a different scoring metric. Importance is evidence about a model — not a verdict about the world.
Knowledge check
Final check
Finish the article by checking the ideas you just learned.
References
Build stronger machine learning foundations
Use structured resources to connect theory, scikit-learn workflows, and evaluation practice.


