
PCA and Dimensionality Reduction: Compress Variation Without Losing the Plot
Most people assume PCA "removes unimportant features." It does not. It rotates your data into new directions ranked by variance, then drops the quietest…

Key topics
Most people assume PCA "removes unimportant features." It does not. It rotates your data into new directions ranked by variance, then drops the quietest ones. That distinction—rotation versus deletion—is the difference between compressing your data and butchering it.
Why Many Correlated Features Are a Problem Worth Solving
Imagine a dataset with fifty columns. You gathered every measurement you could, and now you face the consequences: the model trains slowly, visualization is impossible, and you suspect much of that information is redundant.
Here is the uncomfortable truth about correlated features: they repeat each other. If your dataset tracks both a person's height in centimeters and their height in inches, those two columns carry the same information twice. Real datasets are rarely that blatant, but the pattern holds. Income and credit score correlate. Square footage and number of rooms correlate. Temperature and energy consumption correlate. Fifty columns may carry the signal of ten independent directions, or five, or two.
High dimensionality is not just a computational nuisance. It gives models more room to memorize noise instead of learning structure. It makes patterns harder to see because you cannot plot a fifty-dimensional cloud of points. And it forces you to guess which columns matter when the honest answer is that no single column carries the whole story.
The goal is not fewer columns for their own sake. The goal is fewer independent directions that still capture the structure. That raises the question this article answers: what can you drop without losing the plot?
What PCA Actually Does: A Rotation, Not a Deletion
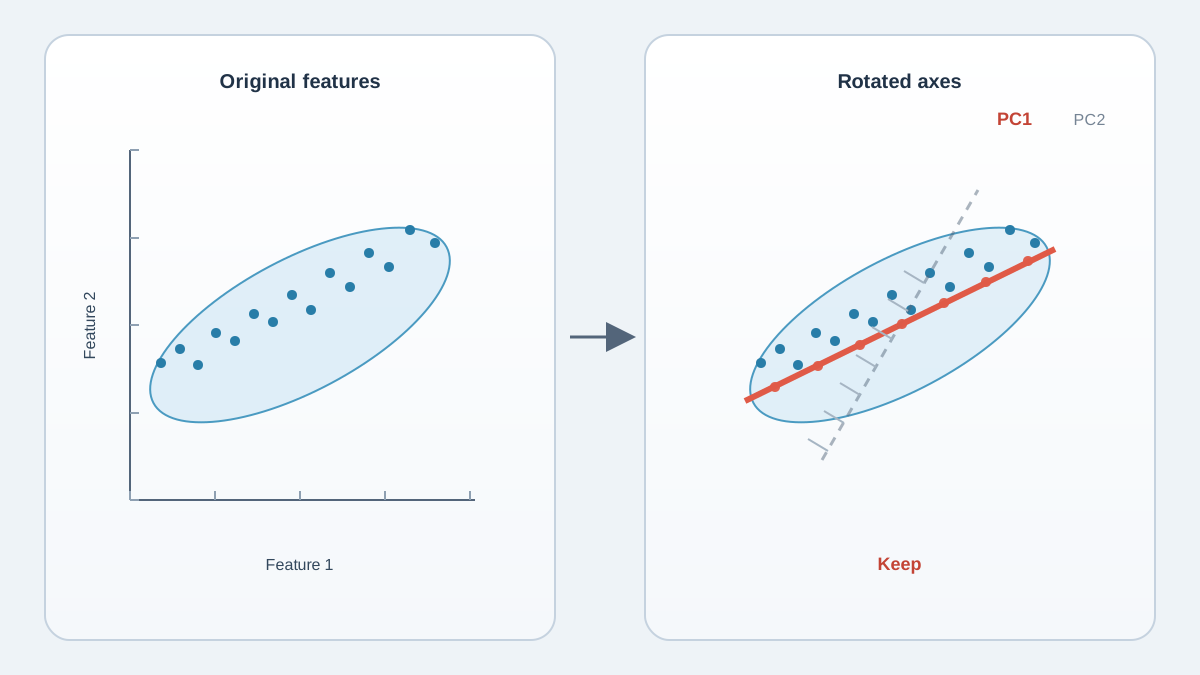
Principal component analysis answers that question in a specific way. It finds new axes—called principal components—that are weighted blends of your original features. The first principal component points in the direction where your data varies the most. The second points in the direction of most remaining variance, with one constraint: it must be perpendicular to the first. Each subsequent component follows the same rule.
Picture an ellipse of data points on a two-dimensional scatter plot. If the points form a long, narrow cloud tilted at an angle, PCA rotates your coordinate system so the long axis of that cloud becomes your new x-axis. That long axis is PC1. The short axis, perpendicular to it, is PC2. Projecting your data onto these new axes is a rotation of your coordinate system, not a selection of your original columns.
This is the mental model that matters: PCA dimensionality reduction is compression, not feature selection. Feature selection keeps original columns and discards others—you might keep "income" and drop "credit score." PCA creates new synthetic columns that blend all the originals. You cannot look at a principal component and say "this is the income feature." It is a weighted combination of income, credit score, and everything else you fed in.
That trade matters. Compression buys you compactness and decorrelation. It costs you the ability to point at a component and explain what it means in the language of your original data.
Knowledge check
Check your understanding
Answer this question before you continue.
Explained Variance: Reading How Much You Keep
Once PCA has rotated your data, each component carries a share of the total variance. In scikit-learn, explained_variance_ratio_ reports those shares directly. The first component might explain 60 percent of your data's variance, the second 25 percent, the third 8 percent, and so on down a long tail of near-zero contributions.
The practical question is where to cut. Two tools dominate:
Cumulative explained variance. Add components until you cross a threshold—commonly 90 to 99 percent. If your first three components explain 96 percent of the variance, keeping three components means you have preserved 96 percent of your data's structure while discarding most of your columns.
The scree plot. Plot each component's explained variance in order. You will often see a sharp drop after the first few components, followed by a long flat tail. That drop is a candidate boundary: components in the flat tail each explain a sliver of variance, so they are natural candidates to cut if you need a compact representation.
Real examples make this concrete. In one hyperspectral imaging study, researchers compressed 125 spectral bands down to two principal components while retaining over 99 percent of the variance. The first component alone explained nearly 99 percent. That is an extreme case of redundancy, but it shows how much repetition high-dimensional data can hide.
One warning before you trust the threshold: explained variance measures how much variation you kept, not whether that variation predicts your target. You can retain 99 percent of the variance and still discard the one direction that separates your classes. Variance and predictive signal are not the same thing.
Common mistake: Treating the scree plot's flat tail as proof those components are noise. Low-variance directions can carry predictive signal, especially for rare classes or subtle effects. The scree plot proposes candidate cut points; it does not decide what your task needs.
Knowledge check
Check your understanding
Answer this question before you continue.
Scaling First: Why PCA Without Standardization Misleads
PCA works by maximizing variance. That single fact creates a trap: variance is scale-sensitive.
If your dataset includes income measured in dollars and age measured in years, income will dominate the variance calculation purely because its numbers are larger. A feature measured in thousands of dollars can dwarf a feature measured in single digits, and PCA will happily declare that the income direction is the most important—not because income carries more signal, but because its units are bigger.
Standardizing fixes this. Centering each feature and scaling it to unit variance puts every column on equal footing before PCA searches for directions. This is the same feature scaling you need for distance-based algorithms, and it is non-negotiable before PCA unless you have a deliberate reason to skip it.
The classic beginner mistake is running PCA on raw features and wondering why one column dominates the first component. The answer is almost always units, not signal. Scale first, then rotate.
Knowledge check
Check your understanding
Answer this question before you continue.
When PCA Helps: Visualization, Noise, and Modeling
PCA earns its place in three honest scenarios.
Visualization. You cannot plot fifty dimensions, but you can plot two. Projecting your data onto its first two principal components gives you the highest-variance linear view of your data. That view can reveal clusters, outliers, and gradients that were buried in the full-dimensional space.
Noise reduction. Components with tiny variance are often dominated by noise. Dropping them can raise the signal-to-noise ratio for downstream models. This is why some fraud detection datasets ship with PCA-transformed columns: the raw transaction features are compressed into a smaller set of decorrelated components that preserve patterns while shedding noise and anonymizing the original fields.
Modeling. Fewer, decorrelated inputs mean faster training and less room for overfitting when your original features are highly redundant. If your fifty columns really carry ten directions of information, a model trained on those ten directions may generalize better than one forced to sift through fifty noisy, correlated inputs.
Notice what these use cases share: they all treat PCA as an unsupervised preprocessing step. PCA never looks at your target variable. If you need directions that separate your classes, a supervised method like linear discriminant analysis will do that job better because it uses the labels. PCA finds variance; LDA finds separation.
Note: For supervised modeling, explained variance can propose candidate component counts, but it cannot choose the winner. The only honest test is empirical: build a baseline pipeline without PCA, build a second pipeline with PCA, and compare them using the same cross-validation procedure. Tune
n_componentsinside that pipeline, and keep PCA only when it improves your metric or meaningfully reduces cost under your real constraints.
When PCA Hurts: What It Cannot Preserve
PCA is a linear method. It finds straight axes through your data, and that linearity sets hard limits on what it can capture.
If your data lives on a curved surface—imagine a spiral or a rolled sheet of paper—PCA will flatten it and lose the structure entirely. The directions of maximum variance in a straight-line sense do not follow the curve. Nonlinear dimensionality reduction methods exist for those cases, but PCA cannot see them.
The deeper problem is that variance is not the same as what your question cares about. PCA will happily preserve the direction of maximum spread even when that spread is irrelevant to your prediction task. If your classes differ along a low-variance direction, PCA may discard exactly the variation you need. Because it never consults your labels, it cannot know better.
Interpretability suffers too. Each principal component is a blend of every original feature, so the clean story of "this column means X" disappears. You trade meaning for compactness, and sometimes that trade is not worth making.
There is also a leakage trap hiding in the workflow. Fit PCA on your training data only, then transform your test data using that same fitted transformation. If you fit PCA on the full dataset before splitting, information from your test set leaks into your training pipeline, and your evaluation metrics will lie to you about how well your model generalizes.
Compression vs. Feature Selection: The Mental Model That Sticks
Here is the decision frame worth carrying forward:
Feature selection keeps original columns and their meaning. You lose some columns, but every column you keep still says what it always said. Choose this when interpretability matters—when you need to explain to a stakeholder, a regulator, or yourself why the model made a decision.
PCA creates new synthetic columns and trades meaning for compactness. You keep the shape of your data but lose the ability to read individual components in your original vocabulary. Choose this when you need compact, decorrelated inputs for visualization, noise reduction, or modeling speed.
The right question is never "does PCA reduce dimensions?" It always does. The right question is "what am I willing to lose in exchange?"
Compression keeps the plot's shape while changing the axes. Feature selection keeps the axes but drops parts of the plot. Know which operation you are performing before you run either one.
Knowledge check
Check your understanding
Answer this question before you continue.
The Practical Path Forward
When you face a dataset with many correlated features, run this sequence: standardize every column, fit PCA on your training data only, inspect the cumulative explained variance and the scree plot, and decide how many components genuinely carry structure. Then ask yourself the question that determines everything else: do you need interpretable original features, or will compact synthetic ones serve your goal?
If you are modeling a target, do not stop at the variance threshold. Compare a no-PCA baseline against a PCA pipeline using cross-validation, and let the validation metric settle whether the compression actually helped.
If you are exploring structure, project your data onto the first two components and look. Treat any clusters you see as hypotheses, not conclusions—a two-dimensional projection can hide separation that exists in other dimensions, and apparent groups may not survive in the original space. Check promising patterns against your original features before acting on them. If the structure holds, you have found exactly the kind of unlabeled pattern that clustering algorithms are built to investigate—a natural next step for anyone exploring what their data is actually saying.
Knowledge check
Final check
Finish the article by checking the ideas you just learned.
References
- Assessing the Effect of PCA-Based Dimensionality Reduction on Machine Learning Performance in Hyperspectral Optical Imaging
- Dimensionality Reduction with Neighborhood Components Analysis — scikit-learn 0.24.2 documentation
- DIMENSION REDUCTION 1 Principal Component Analysis ...
- Build a Fraud Detection model on Cloud AI Platform with TensorFlow Enterprise and BigQuery | Google Codelabs
Research updated Sep 8, 2026


