
K-Means Clustering Explained: Group Data by Proximity, Then Question the Groups
K-means does not discover the real categories hiding in your data. It draws geometric boundaries around points that happen to sit close together. Those…

Key topics
K-means does not discover the real categories hiding in your data. It draws geometric boundaries around points that happen to sit close together. Those boundaries can be useful, even insightful—but they only mean what your question and your assumptions allow them to mean.
What K-Means Actually Does (and Does Not Find)
Here is the mental model that will save you from the most common clustering mistake: K-means is an optimization procedure over geometry, not a truth-finder.
Give the algorithm a dataset and a number k, and it will partition your points into k groups. The rule for grouping is simple: each point belongs to the cluster whose center—the centroid—is nearest. The centroid is just the mean position of all the points in that cluster, the anchor each point is measured against.
The output is a geometric statement: these points are close to this center. Nothing more.
That sounds obvious when stated plainly, but it is easy to forget once you see clean clusters on a scatter plot. You will be tempted to name them: "the bargain shoppers," "the power users," "the risky accounts." Resist the naming impulse until you have done the harder work of checking whether the geometry actually serves your question.
Here is why the caution matters: the same data can be split many valid ways. Change k from 3 to 5 and you get a different grouping. Scale one feature differently and the boundaries shift. Neither grouping is "wrong"—each is a different geometric statement about the same points. In unsupervised learning, there is no ground-truth label telling you which split is correct. You are looking for structure, and the structure you find depends on the lens you choose.
Knowledge check
Check your understanding
Answer this question before you continue.
How K-Means Works: Assign, Recompute, Repeat
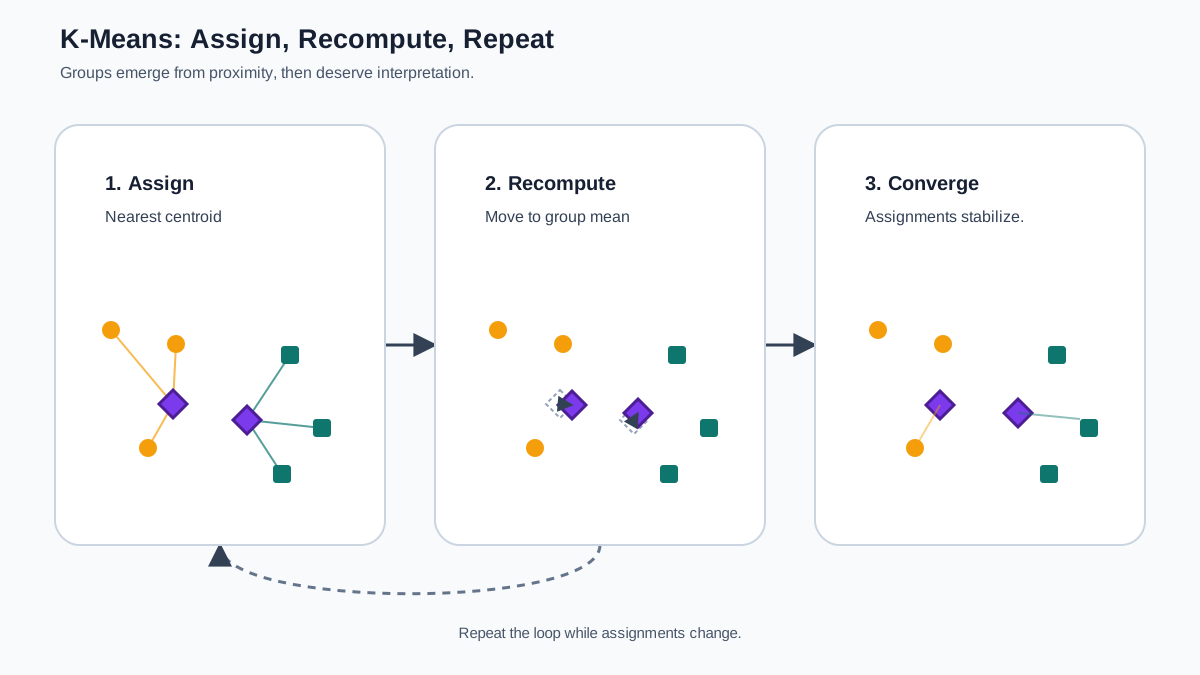
Picture the algorithm as a simple loop with two steps.
Step 1: Assign. Start with k centroids placed somewhere in your feature space. Assign each data point to the nearest centroid.
Step 2: Recompute. Move each centroid to the mean position of all the points currently assigned to it.
Then repeat: reassign every point to the nearest (now moved) centroid, recompute the means again, and keep going until the assignments stop changing. That moment of stability is convergence.
What objective is the loop actually chasing? K-means minimizes the within-cluster sum of squares (WCSS) —the sum of squared Euclidean distances from each point to its assigned centroid. Squared distances, not plain distances. That subtlety matters: squaring means that points far from a centroid are penalized disproportionately.
Now watch why the two steps fit together. When the centroids are fixed, assigning each point to its nearest centroid is the best possible choice—no other assignment could lower that point's contribution to the total. When the assignments are fixed, moving each centroid to the mean of its points is likewise optimal, because the mean is the center that minimizes squared error. Each step either lowers the WCSS or leaves it unchanged. The loop cannot get worse; it can only improve or stabilize.
That guarantee has a limit. The algorithm descends into a local minimum—a configuration where no single step improves the score—but nothing promises that this local minimum is the best possible grouping overall. A different starting position could lead the algorithm to a different, possibly better, solution. The loop is greedy in the best sense: it reliably improves, but it cannot see past the valley it happens to be descending into.
A useful way to watch this happen: imagine a scatter plot with three obvious blobs. Drop three random centroids on the plot. Points snap to their nearest centroid, the centroids drift toward the centers of their assigned points, and within a few iterations the centroids settle into the middle of each blob. The movement is visible, almost physical—centroids sliding across the plot until the configuration stabilizes.
Why Scaling Changes the Answer
Because K-means measures Euclidean distance, it inherits a sensitivity to feature magnitude. A feature measured in dollars can silently dominate a feature measured in units, not because dollars are more meaningful, but because the dollar range is numerically larger.
Suppose you cluster customer data with two features: annual spending in dollars (ranging from 0 to 50,000) and purchase frequency per month (ranging from 0 to 20). The spending axis spans thousands of units; the frequency axis spans dozens. Euclidean distance will be decided almost entirely by spending. Two customers with similar spending will cluster together even if one shops twice a month and the other shops twenty times.
The fix is straightforward: standardize or normalize your features before clustering so that no single feature's magnitude hijacks the geometry. This is the same feature-scaling discipline you apply to other distance-based algorithms. Tree models do not need this treatment—they split on thresholds per feature—but K-means measures across features at once, so scale is baked into the result.
My rule: if the features have different units or wildly different ranges, scale first. If they are already on comparable scales and you have a reason to preserve the raw geometry, you can skip it—but know that you are making a choice about what "close" means.
Knowledge check
Check your understanding
Answer this question before you continue.
Initialization and the Random-Start Problem
K-means starts with random centroids, and random starts can land in poor local minima. Run the algorithm twice on the same data and you can get two different clusterings. The first run might find a sensible grouping; the second might settle into a configuration where one centroid straddles two real blobs and another sits uselessly between them.
This is not a bug in your code. It is a structural property of the algorithm: K-means greedily improves its objective from whatever starting point it is given, and it has no way to escape a bad local minimum once it converges there.
Two practical habits fix most of the pain. First, use k-means++ initialization, which spreads out the starting centroids to reduce the chance of a bad start. Scikit-learn's KMeans uses this by default, so you get it without extra work. Second, run multiple initializations and keep the solution with the lowest WCSS. Scikit-learn does this too via the n_init parameter.
One more habit for reproducibility: set a random_state when you run KMeans. Otherwise you will get different clusters on different runs, and you will not be able to tell whether a change in results came from your data or from the random draw.
Knowledge check
Check your understanding
Answer this question before you continue.
Choosing the Number of Clusters k
K-means requires k before it starts. You must supply the number of groups, and no method will hand you the "true" value, because no true value exists outside your investigative question.
Two tools help you choose a defensible k.
The elbow method plots WCSS against k and looks for a bend: the point where adding another cluster stops buying much reduction in total squared distance. The name comes from the shape of the plot—a curve that drops steeply, then flattens into an arm. The elbow is where you stop. The catch is that real data often produces a smooth curve with no sharp bend, and the elbow you see can depend on how you squint at the plot.
The silhouette score measures how similar each point is to its own cluster compared to neighboring clusters. Scores range from -1 to 1, with higher values indicating points that sit comfortably inside their cluster rather than on a boundary. You compute the average silhouette across values of k and pick the k with the best score. This is more objective than eyeballing an elbow, but it still rewards the algorithm's own geometric assumptions: compact, well-separated clusters score well, whether or not those clusters mean anything for your problem.
Neither method reveals hidden truth. Both help you pick a k that is defensible for your question. Treat k as a modeling choice, not a buried fact to be excavated. If you are clustering customers to design three marketing campaigns, k = 3 may be the right answer because you have three campaign slots—not because three is the mathematically ordained number of customer types.
When K-Means Is the Wrong Tool
K-means carries geometric assumptions that fail quietly on certain data shapes.
It tends to favor clusters that are roughly circular and similarly sized. Elongated clusters, crescent shapes, nested rings, or regions of varying density will be chopped incorrectly. A long, thin cluster spanning the plot may be split into several pieces because Euclidean distance to a centroid does not respect the shape of the data.
Outliers are another weakness. A single distant point can pull a centroid toward itself, distorting the entire cluster. And because K-means assigns every point to a cluster, outliers do not get flagged—they get absorbed, warping the group that inherits them.
When your data has irregular shapes or significant noise, reach for other approaches. Density-based methods group points where they are densely packed and leave sparse regions unassigned. Hierarchical clustering builds a tree of nested groupings that you can cut at different levels. These are different tools for different geometric situations, and knowing when K-means is the wrong tool is part of using it well.
Use K-means when you expect roughly spherical, similarly sized groups and you want every point assigned. Question it when your data has irregular shapes, extreme outliers, or meaningful points that belong to no group at all.
Knowledge check
Check your understanding
Answer this question before you continue.
Interpreting Clusters Cautiously
Once you have clusters, the real work begins: figuring out whether they mean anything. Separate three questions that beginners often blend together.
Does the fit look good? This asks whether points are compact under the geometry you chose. The WCSS and silhouette score speak to this. A low WCSS or a high silhouette tells you the clusters are tight and well separated in the feature space you built—nothing more.
Is the result stable? Run K-means several times with different random seeds and see whether the same groupings reappear. Stable clusters across runs are more trustworthy than configurations that reshuffle every time. If you have known labels available, compare your clusters against them—not to declare victory, but to see where the geometry aligns with your categories and where it cuts across them.
Is the grouping useful? This is the question that actually matters. Does the cluster support the decision you need to make or the investigation you are pursuing? A cluster can score well on fit, prove stable across runs, and still be useless for your problem—or it can look messy by geometric metrics and still point you toward a segment worth acting on.
When you inspect a cluster, do not stop at its centroid. A centroid is an average, and an average can hide a lot. A cluster with a tidy center might contain two distinct subgroups straddling a boundary, or one dominant type plus a few stragglers that got absorbed. Before you name a cluster, check its size, look at the spread of feature values inside it, and pull out a few representative members. Ask whether the points in the cluster actually resemble one another, not just whether they share a center.
The discipline is to treat every cluster as a hypothesis about structure, not a discovered category with automatic meaning. A cluster is a starting point for investigation. It tells you that certain points sit near each other in your chosen feature space under your chosen scaling and your chosen k. Whether that proximity corresponds to something real in the world—a customer segment, a market condition, a biological state—is a question you answer by inspecting the clusters, testing their stability, and asking whether the grouping helps you act.
The same data can support different, equally valid groupings. That is not a failure of the algorithm. It is the nature of unsupervised learning: you are exploring structure, and structure depends on the lens.
The Practical Path Forward
Treat K-means as a tool for exploring geometric structure, not for discovering truth. Run it on a small dataset, inspect the centroids and the spread of points inside each cluster, try two different values of k, and ask whether the groups answer your actual question before you trust them as categories.
The algorithm will happily draw boundaries around your points. Your job is to decide whether those boundaries illuminate something worth seeing—or merely reflect the assumptions you brought to the data.
Knowledge check
Final check
Finish the article by checking the ideas you just learned.
References
Research updated Sep 8, 2026


