
Hierarchical Clustering vs K-Means: Two Ways to Explore Groups
Most beginners ask the wrong question first. They ask, "Which clustering algorithm is better?" The real question is, "Which question am I actually trying…

Key topics
Most beginners ask the wrong question first. They ask, "Which clustering algorithm is better?" The real question is, "Which question am I actually trying to answer?" K-means and hierarchical clustering are not rivals fighting for the same job. They are two different tools that answer two different questions about your data.
K-means asks: Given that I want k groups, where are their centers? Hierarchical clustering asks: What nested structure exists in this data, and at what level of detail should I look? Once you see that distinction, the choice between them becomes much clearer.
The Question Behind the Algorithm
Let's make the distinction concrete. If you already have a strong reason to believe your data contains a specific number of groups—say, three customer segments or two patient populations—K-means is built for that. You tell it how many groups you want, and it finds the best partition it can under that constraint.
Hierarchical clustering works differently. It never asks you for a number of groups up front. Instead, it builds a complete tree of nested groupings, from every point in its own cluster all the way up to one cluster containing everything. You decide later where to cut that tree.
This is not a minor implementation detail. It changes the entire workflow. With K-means, you commit to k before you see any results. With hierarchical clustering, you explore the structure first and decide the granularity after you have evidence in front of you.
If you need a refresher on how K-means optimizes centroids and why it is sensitive to scaling and initialization, that background matters here. The short version: K-means is an optimization procedure that minimizes the distance between each point and its assigned cluster center, and it can settle into different solutions depending on where it starts.
Knowledge check
Check your understanding
Answer this question before you continue.
How Each Method Builds Its Groups
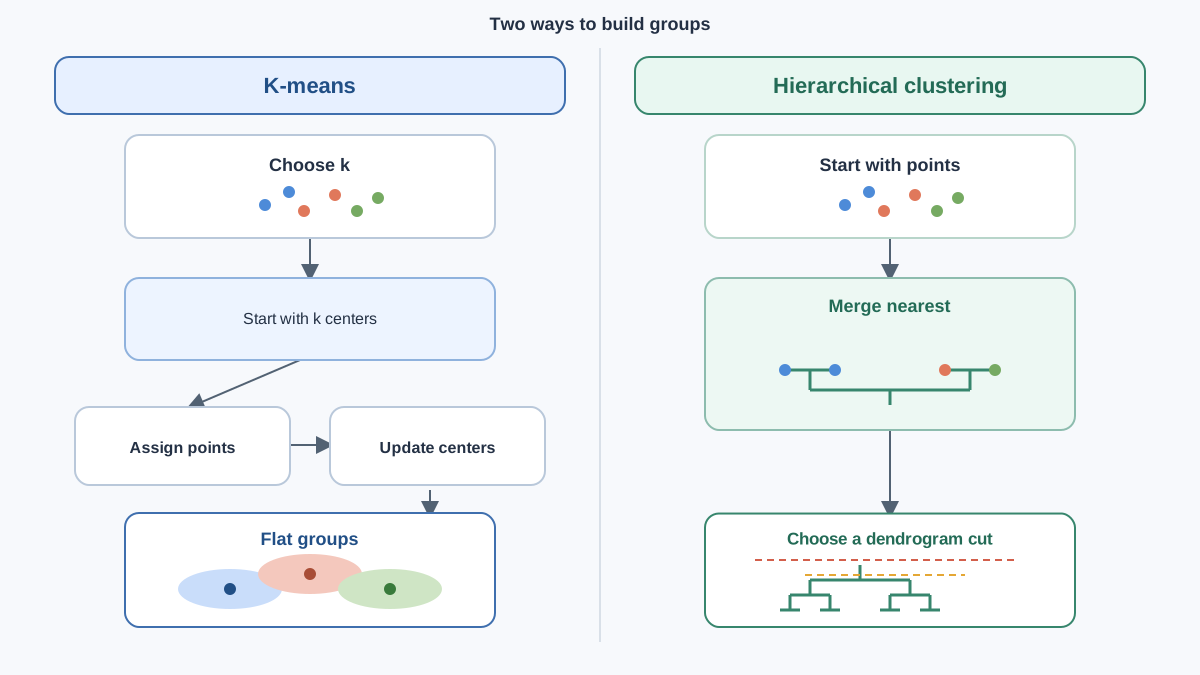
The mechanisms could hardly be more different.
K-means works directly on your data points. It starts by picking k random centroids, assigns every point to the nearest centroid, then recomputes each centroid as the mean of its assigned points. It repeats those two steps—assign, recompute, assign, recompute—until the assignments stop changing. The output is a flat partition: every point belongs to exactly one of k groups, and that is the end of the story.
Agglomerative hierarchical clustering works bottom-up and operates on a pairwise distance matrix rather than on the raw points. It starts with every point as its own cluster. Then it repeatedly merges the two closest clusters, using a linkage rule to define what "closest" means between two groups of points. It keeps merging until one cluster remains.
That linkage rule matters more than beginners expect. Single linkage merges clusters based on the minimum distance between any two points. Complete linkage uses the maximum distance. Average linkage uses the mean. Ward's method merges clusters in a way that minimizes the total within-cluster variance. Each rule produces a different tree, and none of them is universally "correct." The choice depends on the shape of structure you are looking for.
Picture the difference visually. K-means draws a flat map with k colored regions. Hierarchical clustering draws a family tree of merges, showing which points joined which groups at what distance. One gives you a snapshot. The other gives you a history.
What the Dendrogram Gives You That K-Means Cannot
The dendrogram is the signature output of hierarchical clustering, and it deserves special attention because it changes what you can learn from your data.
A dendrogram is a tree diagram where the vertical axis shows the distance at which clusters merged. Points that merge low on the tree are very similar. Groups that only merge near the top are very different. The tree records the entire merging history of your dataset.
Here is what makes that powerful: you can cut the tree at any height and get a different number of clusters. Cut it low, and you get many small, tight groups. Cut it high, and you get a few large, broad groups. You never have to rerun the algorithm. The tree already contains every possible granularity, from n clusters down to 1.
This is invaluable when you have no prior belief about the number of groups in your data. Instead of guessing k before you see anything, you can inspect the tree and look for the largest vertical gaps. A big gap between merge heights suggests that the clusters being joined at that level are quite distinct, which is a reasonable place to cut.
The dendrogram also reveals something K-means hides completely: whether your clusters are cleanly separated or blend into each other. If the tree shows long, clear branches, you have well-separated groups. If it shows a ladder of nearly equal merges, your data may not have meaningful clusters at all. A K-means label vector will happily assign every point to a cluster regardless of whether clusters actually exist. The dendrogram at least lets you see the absence of structure.
Where K-Means Wins: Scale and Speed
Hierarchical clustering pays a price for that rich output, and the price is computational.
K-means scales roughly linearly with the number of points. On a dataset with hundreds of thousands of rows, it runs quickly and uses modest memory. This is why it remains the workhorse for large-scale clustering problems.
Agglomerative clustering requires computing and storing an n-by-n distance matrix. Every point needs a distance to every other point. For 1,000 points, that is roughly 500,000 pairwise distances. For 100,000 points, it is 5 billion. The cost grows with the square of your sample size, and the memory requirement grows with it.
In practice, hierarchical clustering handles thousands of points comfortably. It becomes slow and memory-hungry in the tens of thousands, and it becomes impractical at the scale where K-means is just getting comfortable.
There is a second, subtler advantage to K-means at scale. Because it uses random initialization, you can run it many times with different random seeds, compare the results, and check whether the clusters are stable. Rerunning hierarchical clustering on a large dataset is expensive enough that you will rarely do it more than once or twice.
My practical rule: dataset size is often the first filter that eliminates one of the two options. If you have more than roughly 20,000 to 50,000 points, K-means is usually the only realistic choice unless you have a good reason to subsample.
Knowledge check
Check your understanding
Answer this question before you continue.
Geometry, Scaling, and the Shape Assumption
Both methods carry hidden assumptions about the shape of your clusters, and beginners routinely get burned by ignoring them.
K-means assumes roughly spherical, similarly sized clusters. That assumption follows directly from the math: it minimizes squared distance to a centroid, which is equivalent to fitting circular clusters in two dimensions or spherical ones in higher dimensions. If your data contains elongated, crescent-shaped, or nested clusters, K-means will slice through them in ways that make no sense for your problem.
Hierarchical clustering is more flexible about shape, but it is not shape-agnostic. The linkage rule determines what kind of structure the algorithm can find. Single linkage can follow elongated chains but struggles with noisy data. Complete linkage tends to find compact, ball-like clusters. Ward's method also favors roughly spherical clusters because it minimizes variance. The flexibility is real, but it is conditional on your choice of linkage.
Both methods share a sensitivity that surprises many beginners: feature scaling. Distance calculations treat every feature as equally important. If one feature ranges from 0 to 1,000 and another ranges from 0 to 1, the first feature will dominate the distance calculation completely. Your clusters will effectively be defined by that one feature.
Standardize or normalize your features before running either algorithm. This is not optional polish. It changes the result, often dramatically.
Neither method handles outliers or density-based clusters well. If your data has meaningful structure in regions of varying density, or if outliers will distort your results, neither K-means nor hierarchical clustering is the right tool. That is a job for density-based methods like DBSCAN. Knowing when to step outside these two options is part of choosing well.
Knowledge check
Check your understanding
Answer this question before you continue.
Choosing k: Elbow, Dendrogram, and Honest Limits
Every clustering workflow eventually confronts the same question: how many groups actually exist? The two methods answer it in very different ways.
With K-means, you must choose k before running. The common heuristics are the elbow method and the silhouette score. The elbow method plots within-cluster variance against k and looks for the point where adding more clusters stops producing large improvements. The silhouette score measures how similar points are to their own cluster compared to other clusters.
Treat these as rough guides, not proofs. The elbow method in particular is famously subjective—the "elbow" is often a gentle curve rather than a sharp bend. And clustering heuristics suffer from a deeper problem: clusters are not a ground-truth label waiting to be discovered. They are structures that emerge from your choice of distance metric, scaling, and algorithm. Different choices produce different "truths."
Hierarchical clustering gives you a more informative path. Instead of a single scalar score, you inspect the dendrogram and cut where the largest vertical gaps appear. A large gap means the merge at that level joined two quite distinct groups, which is a natural place to stop. This is often more interpretable than an abstract score because you can see the structure directly.
The honest framing is uncomfortable but important: clustering finds structure, but it does not validate that the structure means anything for your question. The groups exist because the algorithm created them. Whether they are useful is a judgment you make against your actual investigative goal.
Knowledge check
Check your understanding
Answer this question before you continue.
A Decision Rule for Choosing
Here is the practical framework I use when deciding between hierarchical clustering vs K-means.
Choose K-means when:
- You have a specific reason to expect a particular number of groups
- Your dataset is large enough that a pairwise distance matrix is impractical
- Roughly spherical, similarly sized clusters are plausible for your data
Choose hierarchical clustering when:
- You do not know how many groups exist and want to discover that from the data
- You want to inspect nested structure or sub-clusters within larger groups
- Your dataset is small enough that computing and storing pairwise distances is feasible
| Criterion | K-Means | Hierarchical Clustering |
|---|---|---|
| Output | Flat partition of k groups | Nested tree (dendrogram) |
| Number of clusters | Must be specified in advance | Chosen after the fact by cutting the tree |
| Scalability | Scales roughly linearly; handles large datasets | Requires n-by-n distance matrix; struggles beyond tens of thousands of points |
| Shape assumption | Roughly spherical, similar-sized clusters | Depends on linkage rule; more flexible but not shape-agnostic |
| Interpretability | Cluster centers and labels | Dendrogram shows merging history and structure |
| Reproducibility | Varies with random initialization; run multiple times | Deterministic given the same distance matrix and linkage |
Both methods are exploratory tools. Treat their output as a hypothesis about structure, not a discovered truth. The real test of any clustering is whether the groups help you answer the question that sent you looking for clusters in the first place.
And when neither method fits—when your data has elongated clusters, significant outliers, or varying density—name that limit honestly rather than forcing one of these two tools to do a job they were not built for.
The Next Step
The best way to internalize this comparison is to run both methods on the same small dataset. Take something with a few hundred points, standardize the features, run K-means with several values of k, and build a hierarchical clustering with the same data. Cut the dendrogram at the height that gives you the same number of clusters as your best K-means run. Then compare the assignments.
Where do they agree? Where do they disagree? The disagreements are the most informative part. They will show you exactly where the geometric assumptions of each method diverge, and they will teach you more about your data than either algorithm could alone.
Knowledge check
Final check
Finish the article by checking the ideas you just learned.
References
Research updated Sep 8, 2026


