
Clustering Validation: Are Your Groups Real or Just Convenient?
Every clustering algorithm will happily partition pure noise into tidy groups. Run k-means on random data, and it returns clean circles of assigned points.…

Key topics
Every clustering algorithm will happily partition pure noise into tidy groups. Run k-means on random data, and it returns clean circles of assigned points. Plot those assignments on a PCA scatter, and your eye will find structure that was never there. That is the central trap of unsupervised learning: clustering always produces an answer, so the real question is whether that answer survives scrutiny.
Because clustering has no ground-truth labels to check against, you need other ways to test your groups. This guide walks through three complementary lenses: internal metrics that measure cluster quality from the data alone, stability checks that test whether groupings survive perturbation, and domain judgment that asks whether the groups mean anything at all.
Each lens supports a different claim. Internal metrics support a geometric claim: the clusters are compact and well separated. Stability supports a reproducibility claim: the same partition reappears when you perturb the data or rerun the algorithm. Domain judgment supports a usefulness claim: the groups correspond to something you can name and act on. A cluster that passes all three is worth trusting. A cluster that passes only one is a hypothesis, not a finding.
Why a Pretty Plot Is Not Proof
Here is the uncomfortable fact about clustering: the algorithm does not discover groups so much as assign them. K-means will partition any dataset you give it, including pure noise, because partitioning is its job. The output is guaranteed; the structure is not.
A two-dimensional PCA projection makes this worse. When you compress high-dimensional data down to two components for visualization, you are showing the reader the flattering angle. Clusters that look beautifully separated in that projection can dissolve completely in the full feature space. The plot is a summary of the data, not proof of its shape.
So what does count as evidence? Three complementary checks:
- Internal metrics measure how compact each cluster is against how well separated it is from others, using only the data and the partition.
- Stability tests check whether the same grouping reappears when you perturb the data or rerun the algorithm.
- Domain judgment asks whether the groups correspond to something you can name, explain, and act on.
No single number or plot is ground truth. Confidence comes from convergence across all three.
Knowledge check
Check your understanding
Answer this question before you continue.
Internal Metrics: Compactness vs. Separation
Internal clustering metrics evaluate a partition using only the data itself—no external labels. They all reduce to a shared intuition: points within a cluster should be close together (compactness), and different clusters should be far apart (separation).
The most widely used example is the silhouette score. For each point, compute two values: a, the mean distance to all other points in its own cluster, and b, the mean distance to all points in the nearest neighboring cluster. The silhouette coefficient for that point is:
[ s = \frac{b - a}{\max(a, b)} ]
The score ranges from -1 to +1. A value near +1 means the point is much closer to its own cluster than to any other—a confident assignment. A value near 0 means the point sits roughly equidistant between clusters. A negative value means the point may be closer to a different cluster than the one it was assigned to, a sign the partition is forcing something unnatural.
Two other metrics are worth knowing because they appear constantly in clustering libraries:
- Calinski-Harabasz (also called the variance ratio criterion) compares the dispersion between clusters to the dispersion within clusters. Higher is better.
- Davies-Bouldin measures the average similarity between each cluster and its most similar neighbor. Lower is better, because it means clusters are not sitting on top of each other.
Here is the hidden assumption these metrics share: they favor globular, roughly spherical clusters. That is fine when your data actually has blob-like structure, and misleading when it does not. Elongated clusters, nested shapes, or density-based groupings can score poorly on internal metrics even when they are the true structure of the data.
Common mistake: Using an internal metric to choose k and then citing that same metric as proof the chosen k is correct. That is circular reasoning—you optimized the score, then treated the optimized score as independent confirmation.
The practical rule: report two or three metrics and look for agreement. If silhouette, Calinski-Harabasz, and Davies-Bouldin all point in the same direction, you have a signal. If they conflict, that disagreement is itself information—usually that your cluster geometry does not match what the metrics assume.
But remember what that agreement means. These three metrics share the same compactness-versus-separation intuition, so they are not independent witnesses. They are three versions of one geometric assumption. Agreement among them is meaningful only when your algorithm also assumes roughly globular, distance-based clusters. If you are using a density-based method or deliberately hunting for irregular shapes, do not expect these scores to agree—and do not treat their disagreement as a verdict against your clustering.
Knowledge check
Check your understanding
Answer this question before you continue.
Stability: Does the Grouping Survive Perturbation?
Internal metrics tell you whether a partition looks good. Stability tells you whether it is reproducible. The distinction matters: reproducibility under a chosen procedure is not the same as discovering naturally meaningful groups. A misspecified algorithm can produce a stable partition—stable, but still artificial.
Think of it this way. Stability asks a narrower question: If I run this exact pipeline again under slightly different conditions, do I get the same partition? The answer depends on what you perturb. Different perturbations diagnose different weaknesses:
- Reinitialize the algorithm. K-means starts from random centroids and can land in different local optima on the same data. Run it multiple times with different seeds and compare. This tests optimization sensitivity: whether your result depends on luck.
- Subsample or bootstrap the data. Draw a random subset of rows, cluster it, draw another, cluster again, and compare the two partitions. This tests sample dependence: whether your groups are anchored in the data or driven by a few influential points.
- Perturb the features. Add small amounts of noise to your variables and watch whether assignments hold. This tests measurement sensitivity: whether your groups survive the kind of noise real data collection introduces.
Comparing partitions across runs requires a label-invariant similarity measure, because cluster numbers are arbitrary. Cluster 0 in one run might be cluster 2 in another, even when the grouping is identical. The adjusted Rand index and normalized mutual information both solve this by measuring agreement between partitions while correcting for chance agreement.
High agreement across runs supports the grouping. Low agreement is a warning to question your cluster count, your scaling, or your algorithm choice—not a signal to defend the current partition.
Note: Stability is especially revealing for k-means because its random initialization can produce meaningfully different results on the same data. If your k-means clusters barely agree across random seeds, you have not found structure; you have found one of many equally arbitrary partitions.
Knowledge check
Check your understanding
Answer this question before you continue.
The Domain Question: Do the Groups Mean Something?
Quantitative checks can tell you that groups are well-separated and reproducible. They cannot tell you that the groups are meaningful. That final judgment is interpretive, not computational.
The decisive test is often disarmingly simple: can you describe what distinguishes each cluster in plain language using your original features?
Consider a customer segmentation that scores well on silhouette and survives stability checks. You profile each cluster by its feature means and discover that your "high-value" cluster is really just customers from one geographic region with higher shipping costs. The grouping is statistically clean and behaviorally meaningless—it is a scaling artifact, not a segment you can market to.
Cluster interpretation is where your earlier feature work pays off. Profile each cluster by its feature means or medians, not by its position on a PCA plot. The projection was useful for exploration; the original features are what let you name the group.
But do not stop at averages. Averages can hide the real story. Before you call a cluster nameable, ask four follow-up questions:
- Are the distributions actually distinct? Two clusters can have different means while overlapping heavily. Check whether the spread tells the same story as the center.
- Are the clusters reasonably sized? A "segment" that contains three customers is an outlier, not a finding.
- Do the separating features survive scrutiny? Would the same groups appear with different preprocessing? Is any feature merely a proxy for how the data was collected?
- What decision changes if the cluster disappears? A nameable cluster is useful only if it changes what you would do next.
When clusters do not map to anything nameable, treat them as a hypothesis to refine, not a discovery to publish. A cluster that cannot be described in domain terms is a candidate for further investigation, not a finding.
External validation—comparing clusters to known labels—is only possible when labels exist, and even then it has limits. Class labels and clusters do not always align. A dataset of medical records might cluster by age when the labels are by diagnosis. The clusters are real; they just do not correspond to the categories you care about.
Knowledge check
Check your understanding
Answer this question before you continue.
A Practical Validation Checklist
Here is the workflow I use when validating clusters, combining all three lenses into one ordered procedure:
Step 1: Scale and cluster with a defensible choice of algorithm and k. Your earlier workflow decisions matter here. If the scaling or cluster count was arbitrary, validation cannot rescue it.
Step 2: Compute internal metrics that match your algorithm's geometry. For roughly globular, distance-based partitions, silhouette, Calinski-Harabasz, and Davies-Bouldin are a solid diagnostic set. Check that they roughly agree before trusting any single score. For density-based or irregular structures, lean on stability and domain criteria instead of expecting these three scores to align.
Step 3: Run a stability check. Reinitialize the algorithm, resample the data, or perturb the features—ideally more than one of these. Compare partitions with the adjusted Rand index or normalized mutual information. Look for consistently high agreement.
Step 4: Profile each cluster in the original feature space. Compute feature means or medians per cluster, then check distributions, cluster sizes, and whether the separating features survive sensible preprocessing. Ask what decision would change if the cluster label disappeared. Write the description down. If you cannot, that is a finding.
Step 5: If checks conflict, revisit earlier decisions. Do not force the current partition to be right. Conflicting evidence usually points to a scaling choice, a cluster count, or an algorithm that does not fit the data's geometry.
Warning: Validation is essential before claiming discovery, but over-validation can stall genuinely exploratory work. If you are using clustering to generate hypotheses on data you have never examined, a quick internal metric plus a stability check is enough to move forward. Save the full checklist for results you plan to present or act on.
The Decision Rule
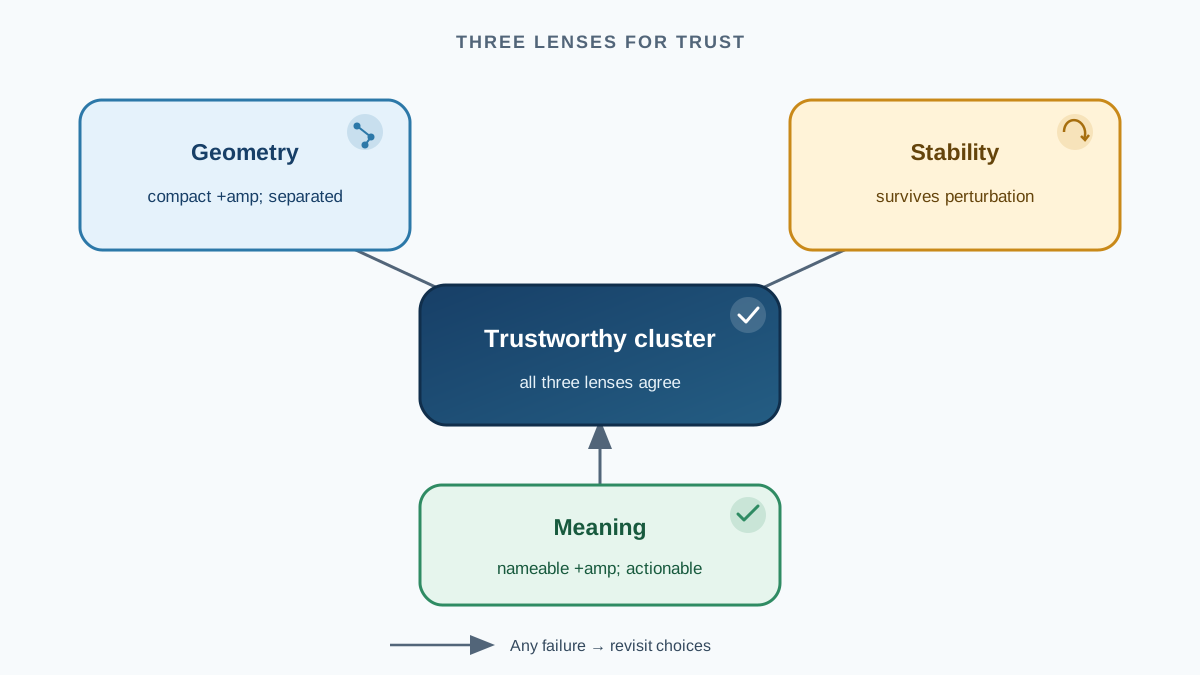
A cluster earns your trust only when it is compact, stable, and nameable. Any one of the three failing is reason to revisit an earlier choice—scaling, cluster count, algorithm—rather than defend the current partition.
The good news is that a failed check is not a personal failure. It is evidence about your data. It tells you the structure you hoped for is not there, or that you are looking at it through the wrong lens. That is exactly what validation is for: catching the difference between groups that are real and groups that are just convenient before you build anything on top of them.
Run the checklist on your own clustering results. Start with the internal metrics, add a stability check, and force yourself to write a plain-language description of each cluster. The clusters that survive all three are the ones worth trusting.
Knowledge check
Final check
Finish the article by checking the ideas you just learned.
References
Research updated Sep 8, 2026


