
Bootstrap Resampling in Machine Learning: Estimate Uncertainty, Not Certainty
Your model scores 0.82 accuracy on the test set. That feels like a fact—something solid you can report and defend. Run the experiment again on a different…

Key topics
Your model scores 0.82 accuracy on the test set. That feels like a fact—something solid you can report and defend. Run the experiment again on a different random sample of data, though, and you might see 0.79. Or 0.84. The single number was never the truth. It was one draw from a distribution you haven't looked at yet.
This is the trap at the heart of model evaluation. We want certainty, but a metric computed on one finite sample is a guess wearing a confident expression. Bootstrap resampling in machine learning exists to show you how much that guess would wobble if you could redraw your data again and again. It replaces a single number with a range—and a range is almost always more honest.
Why One Accuracy Number Is a Guess
Every test score you've computed came from one finite dataset. That dataset is a sample of some larger population of examples your model will encounter in the real world. A different sample would produce a different score, sometimes meaningfully different.
The quantity you actually care about is the sampling distribution of your metric—the full spread of scores you'd see if you could evaluate on many independent samples from the same population. You never observe that distribution directly. You get one point from it and are asked to make decisions.
Here's the practical consequence: two models scoring 0.81 and 0.82 may be statistically indistinguishable. If the spread around each estimate is ±0.03, that 0.01 gap is noise, not progress. Beginners pick the higher number and move on. People who understand uncertainty ask about the spread first.
You already know one way to generate repeated estimates: cross-validation gives you fold-by-fold scores you can average. Bootstrap resampling is a different philosophy for generating those repeats, and it answers a different question. Cross-validation asks, "Which model generalizes best?" Bootstrap asks, "How much do I trust this particular number?"
What Bootstrap Resampling Actually Does
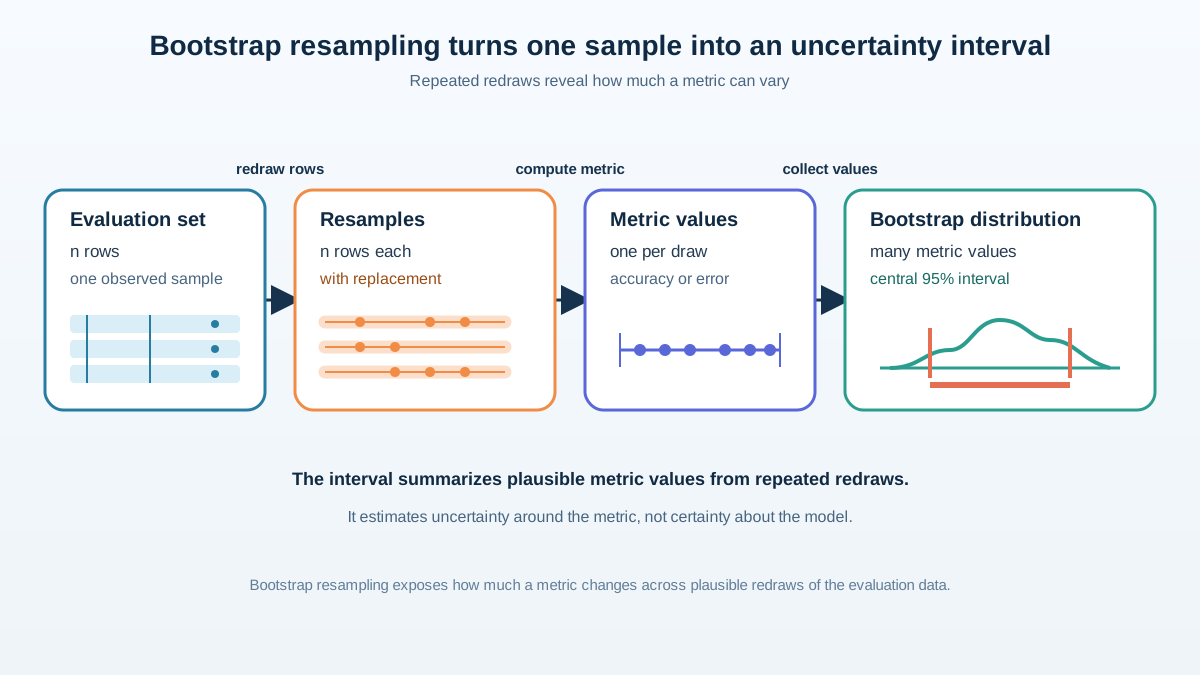
The core move is almost suspiciously simple. Take your original dataset of n rows. Draw a new sample of n rows with replacement. Because rows can repeat, each resample is different from the original—some rows appear multiple times, and roughly a third of the original rows are missing entirely. Compute your statistic on that resample. Repeat hundreds or thousands of times. Look at the spread of results.
That collection of recomputed statistics is called the bootstrap distribution, and it approximates the sampling distribution you never got to observe directly.
Why does this work? The bootstrap treats your original sample as a miniature population. If your sample is reasonably representative of the real world, then resampling from it simulates what other samples from that same world would have looked like. You're not inventing new data. You're asking, "Given what I actually observed, what other datasets like this one were plausible?"
The "with replacement" detail is not a technicality—it's the entire engine. Without replacement, every resample would be identical to the original, and you'd learn nothing about variability. With replacement, each resample varies, and that variation is your uncertainty signal.
This is a non-parametric method. It makes no assumptions about the shape of the underlying distribution—no normality claims, no parametric forms. If your statistic has a sampling distribution at all, the bootstrap can approximate it.
Knowledge check
Check your understanding
Answer this question before you continue.
Know What You Are Resampling
Before you write any code, answer one question: what exactly is the estimate whose variability you want to measure?
There are two very different targets, and confusing them is the most common source of misleading bootstrap results.
Target 1: A fixed model's performance on new cases. You have a trained model. You want to know how much its accuracy would vary if you evaluated it on a different sample of test cases from the same population. Here, you hold the model fixed and resample the evaluation rows. Each replicate recomputes the metric on a new resample of test cases.
Target 2: The whole training-and-evaluation procedure. You want to know how much the metric would vary if you drew a new training set, retrained the model, and evaluated it again. Here, each replicate must resample the training data, retrain the model from scratch, and evaluate on held-out data. This is far more expensive, and it's the target that matches how models actually get built and deployed.
The metric example in this article uses the first target: you have a trained model, you have an evaluation set, and you want to know how much that score would wobble across different samples of evaluation cases.
What the resulting interval does not cover is just as important. It does not cover systematic bias from a bad evaluation design. It does not cover distribution shift between your test data and production. It does not cover the extra variability introduced by model selection or hyperparameter tuning. If you tuned your model on the same data you're bootstrapping, your interval inherits that optimism. A bootstrap interval is a statement about sampling variability under your assumptions—not a general certificate of production reliability.
Knowledge check
Check your understanding
Answer this question before you continue.
Reading a Bootstrap Confidence Interval
The output of a bootstrap is a distribution, but you rarely want to stare at a histogram. You want an interval: the range of plausible values for your metric.
A 95% bootstrap confidence interval is the middle 95% of your bootstrap distribution. If you resampled 10,000 times and got accuracy values ranging from 0.71 to 0.89, the interval might run from roughly 0.74 to 0.86. That range is your honest report: "Based on this data, the model's accuracy is somewhere in this neighborhood."
Be careful about what the interval does not claim. It is not a 95% probability that the true value sits inside this particular interval. It's a statement about the procedure: if you repeated the whole resampling process many times, about 95% of the intervals you constructed would contain the true value. That distinction feels pedantic until someone quotes it wrong in a presentation.
There are different methods for constructing the interval from the bootstrap distribution. The percentile method—just taking the 2.5th and 97.5th percentiles—is the most intuitive, but it assumes the bootstrap distribution is symmetric and unbiased. The basic (reverse percentile) method and the BCa (bias-corrected and accelerated) method correct for skew and bias in different ways. When your tooling supports it, BCa is a reasonable default for many metrics.
The practical reading matters more than the method. A wide interval means your estimate has high sampling variability—often because your evaluation set is small or the metric itself is noisy. A narrow interval means the metric is stable under resampling. But width alone cannot diagnose leakage or dependence problems. A leaky pipeline can produce a narrow, confident interval around a corrupted estimate. The bootstrap faithfully repeats your evaluation design thousands of times; if that design is wrong, the interval is confidently wrong with it.
Common mistake: Quoting the point estimate while ignoring the interval. This hides exactly the uncertainty the method exists to reveal. "Our model achieves 0.82 accuracy" is incomplete. "Our model achieves 0.82 accuracy, with a 95% bootstrap interval from 0.74 to 0.86" is a statement you can actually make decisions on.
Out-of-Bag Intuition and Bagging
Bootstrap resampling isn't only for uncertainty estimation. The same mechanism powers one of the most successful ideas in classical machine learning: bagging, short for bootstrap aggregating.
When you draw a bootstrap resample of n rows from your n-row dataset, about 63% of the original rows appear at least once. The other 37%—the rows that didn't get picked—are called out-of-bag observations. They're free validation data.
Bagging exploits this. Train many models, each on a different bootstrap resample, then average their predictions. Each model sees a slightly different version of the training data, so their errors are partially decorrelated. Averaging them reduces variance without increasing bias. This is exactly how random forests work: hundreds of trees, each trained on its own resample, voting together.
The out-of-bag rows give each model a built-in evaluation set. A tree trained on one resample can be tested on the rows that resample excluded, producing an out-of-bag error estimate without holding out any data. It's a clever recycling of the same resampling mechanism: the rows that create diversity during training also create a validation signal during evaluation.
One boundary worth noting: out-of-bag error is a useful estimate, but it is not a substitute for a disciplined final test in every workflow. It estimates training-data performance under resampling, not performance on genuinely unseen data.
When Naive Resampling Lies to You
The empirical bootstrap carries a hidden assumption, and violating it produces intervals that are quietly, dangerously wrong.
The assumption is that your observations are independent and exchangeable—that each row is an isolated unit and the order or grouping of rows carries no information. This is the same IID assumption that makes random cross-validation folds valid. When it fails, bootstrap resampling fails with it.
Time series are the clearest case. If you're predicting tomorrow's sales from the past year of daily data, resampling individual days destroys the temporal structure your model depends on. A bootstrap resample might put March after August, or repeat the same week five times. The resulting intervals will be too narrow and overconfident because the resampled data no longer resembles the actual process that generated it.
Grouped data breaks the assumption more subtly. Suppose you have patient records with multiple visits per patient. Resampling row-by-row treats each visit as independent, but visits from the same patient are correlated. Your bootstrap will produce intervals that look tight and trustworthy while systematically underestimating the true variability. The fix is to resample at the group level—entire patients, not individual visits.
Leakage is a separate trap hiding in your pipeline. If you fit a scaler or select features before resampling, every bootstrap resample inherits information from the full dataset. The bootstrap faithfully repeats your leak thousands of times, producing confident intervals around a corrupted estimate. The resampling must happen before any preprocessing that uses the whole dataset.
Warning: Before you bootstrap, ask what the true independent unit is. If the answer isn't "individual rows," naive resampling will lie to you. The same dependence questions that invalidate random cross-validation folds also invalidate naive bootstrap resampling.
Knowledge check
Check your understanding
Answer this question before you continue.
Bootstrap vs. Cross-Validation: Which to Reach For
These two resampling methods are constantly confused, but they answer different questions. Cross-validation partitions data into disjoint folds, trains on most of them, and evaluates on the held-out fold. Bootstrap resamples with replacement and recomputes a statistic many times.
| Cross-validation | Bootstrap | |
|---|---|---|
| Primary job | Model selection and comparison | Uncertainty quantification |
| What it repeats | Disjoint train/test splits | Resamples with replacement |
| What it estimates | Generalization performance of candidates | Variability of a specified estimate |
| Typical output | Average score across folds | Distribution, confidence interval |
| Main weakness | Fold spread can mislead; no distributional output | Requires IID assumption; can be overconfident with dependence |
My rule of thumb: when you're choosing between models, reach for cross-validation. When you're reporting how much you trust a number you've already computed, reach for the bootstrap. Model selection needs the disciplined, non-overlapping structure of folds. Uncertainty reporting needs the distributional view that bootstrap provides.
That said, the boundary is not absolute. You can use bootstrap to compare two models on paired resamples, and cross-validation gives you a sense of score variability across folds. The deeper point is that your resampling design must match your claim. If you want uncertainty that includes the effect of model selection or tuning, your resampling has to include those steps—otherwise your interval answers a narrower question than you think.
Both methods assume the same underlying independence. Neither rescues you from grouped or temporal dependence. If your data has structure, you need grouped or time-aware versions of both.
Knowledge check
Check your understanding
Answer this question before you continue.
A Practical Workflow for Your Next Bootstrap
When you're ready to run a bootstrap on a model metric, work through this sequence:
- Name the statistic and the unit. What are you measuring—accuracy, AUC, mean absolute error? And what is the independent unit—a row, a patient, a session, a timestamp?
- Resample at the unit level. If rows are independent, resample rows. If patients are the unit, resample entire patients. If time matters, use a block or time-aware scheme.
- Preserve the evaluation boundary. If your target is a fixed trained model, hold the model fixed and resample evaluation cases. If your target is the full training procedure, resample training data and retrain inside each replicate—with all preprocessing fit inside the resample, never before it.
- Compute the statistic on every replicate. Store each value. Don't average them away.
- Report the interval and its assumptions. Give the range, but also say what you resampled and what the interval does and does not cover.
One more pattern worth knowing: when comparing two models, resample the same cases for both. Paired resampling preserves the correlation between the two models' scores, which makes differences easier to detect. Resampling independently for each model can bury a real difference in unrelated noise.
The Practical Payoff
Here's what bootstrap resampling buys you in practice: the ability to say "I don't know" with precision.
When you report a metric, report the interval. When you compare two models, compare their intervals—ideally from paired resamples—not just their point estimates. When a model that scored 0.82 in testing feels unreliable in production, the bootstrap interval is one piece of the explanation: the estimate carried more sampling variability than the single number suggested. It is not the whole explanation. Distribution shift, label problems, and systematic bias live outside the interval's reach.
The next time you have a familiar dataset and a trained model, run a small bootstrap on your evaluation metric. Watch the interval widen as you shrink the dataset. Watch it narrow as you add more data. That visible movement is the lesson: your metric is an estimate, and bootstrap resampling shows you exactly how much of an estimate it is.
Before you resample, ask the one question that determines whether the whole exercise is meaningful: are the rows truly independent units? Answer that honestly, and the bootstrap becomes one of the most reliable tools you have for understanding what your models are actually telling you.
Knowledge check
Final check
Finish the article by checking the ideas you just learned.
References
Research updated Sep 8, 2026


