
Which Machine Learning Algorithm Should You Use? A Problem-First Decision Guide
You have a tabular dataset, a prediction to make, and a list of algorithm names that reads like a menu in a language you have not learned yet. Random…

Key topics
You have a tabular dataset, a prediction to make, and a list of algorithm names that reads like a menu in a language you have not learned yet. Random forest. Logistic regression. Gradient boosting. Support vector machine. Which one do you pick?
Here is the uncomfortable truth: that is the wrong question. There is no single best algorithm waiting to be discovered. The real skill is learning to narrow a scary field down to a few honest contenders, then letting a fair experiment make the final call.
This guide walks through that narrowing process step by step. By the end, you will know how to translate your problem's constraints into a shortlist of two or three candidate models—and how to compare them without fooling yourself.
Why "best algorithm" is the wrong first question
The beginner trap goes something like this: you assume that somewhere out there, one algorithm is secretly the right answer to your problem, and your job is to find it. So you search for advice on which machine learning algorithm to use, read a few forum threads, and pick whatever sounds most impressive.
That approach fails because it treats model selection like a multiple-choice test. It is not. You are not crowning a champion in advance. You are building a shortlist of candidates worth testing, and the experiment decides the winner.
Think of it like hiring for a job. You would not pick a candidate because they have the most impressive resume. You would narrow the applicant pool based on the role's requirements, then run a fair evaluation and see who performs best. Model selection works the same way.
The discipline this guide teaches has two steps:
- Narrow by constraints. Use what you know about your problem, your data, and your decision context to cut the field down to a few sensible candidates.
- Decide by experiment. Compare those candidates fairly, starting from a simple baseline, and let measured performance make the final call.
One boundary before we start: this guide covers classical supervised learning for tabular data—the kind of structured rows-and-columns data you will meet in most introductory machine learning work. Deep learning and unstructured data like images, audio, or raw text follow different rules and deserve their own treatment.
Knowledge check
Check your understanding
Answer this question before you continue.
Step 1: Name the task before you name the model
Before you can choose an algorithm, you need to know what kind of prediction you are making. The target variable—the thing you are trying to predict—decides this.
If you already know the regression-versus-classification distinction, this section is a quick bridge. If it feels fuzzy, that distinction is worth reviewing first, because every later decision depends on it.
- Regression means predicting a number: house price, temperature, delivery time. Your candidate set points toward linear models and tree-based regressors.
- Classification means predicting a category: spam or not spam, customer churn or retention, digit 0 through 9. Your candidate set points toward logistic regression, decision trees, and tree ensembles.
There is one more filter worth applying at this stage. Do you need probabilities, or just labels? If a doctor needs to know that a patient has a 92 percent risk of readmission, not just "high risk," then the quality of a model's probability estimates matters. A model with well-calibrated probabilities is one where cases predicted at roughly 70 percent risk actually occur about 70 percent of the time. If you only need a yes-or-no flag for a simple rule, almost any classifier will do.
Knowledge check
Check your understanding
Answer this question before you continue.
Step 2: Read your data's shape and size
Your data's practical constraints decide which models are even viable. Before picking anything, look at three things.
Sample size. How many rows do you have? Small datasets—say, a few hundred to a couple thousand samples—favor simpler models that are less likely to memorize noise. Very large datasets can support more flexible models that learn complex patterns without overfitting as easily.
Feature count and type. How many columns do you have? Are they numeric, categorical, or a mix? Do you have hundreds of features, or just five? High-dimensional data with many features changes the calculus, as does data with lots of categorical columns that need encoding.
Sparsity. Is most of your data zeros or missing values? Sparse data—think text represented as word counts, or user-item interaction matrices—has its own set of well-suited models.
Here is the mental model that ties these together: a model is a bet on how much structure your data can support. A linear model bets that a straight-line relationship is good enough. A deep tree ensemble bets that the relationships are complex and interactive. If your data is small, that complex bet is more likely to lose—the model will find patterns that are really just noise.
One warning: treat rules of thumb as starting filters, not verdicts. "Small data means linear models" is a useful first guess, not a law of nature. What matters is whether the data has enough informative variation to support a flexible model's complexity. A dataset with 500 rows and 3 clean features may support a tree ensemble fine; a dataset with 5,000 rows and 200 noisy features may not. The experiment in Step 5 is what actually settles it.
Knowledge check
Check your understanding
Answer this question before you continue.
Step 3: Weigh interpretability and stakes
The data is not the only constraint. Why you are making the prediction matters just as much.
If your model's predictions will be explained to a stakeholder, audited by a regulator, or used to make a high-stakes decision about a person, interpretability is a real requirement, not a nice-to-have. A loan officer cannot say "the model rejected you because of feature interaction 47" and call that an explanation.
Linear models and shallow decision trees are relatively easy to explain. You can point to coefficients or trace the path of a single decision. Tree ensembles like random forests and gradient boosting often predict better, but they trade away some of that clarity—hundreds of trees voting together do not produce a simple story.
My rule is this: if you must explain every prediction, favor the simpler candidate unless the complex one clearly wins on measured performance. And remember that interpretability is a spectrum, not a yes/no switch. A logistic regression with twenty features is harder to explain than one with three.
Build a shortlist from your constraints
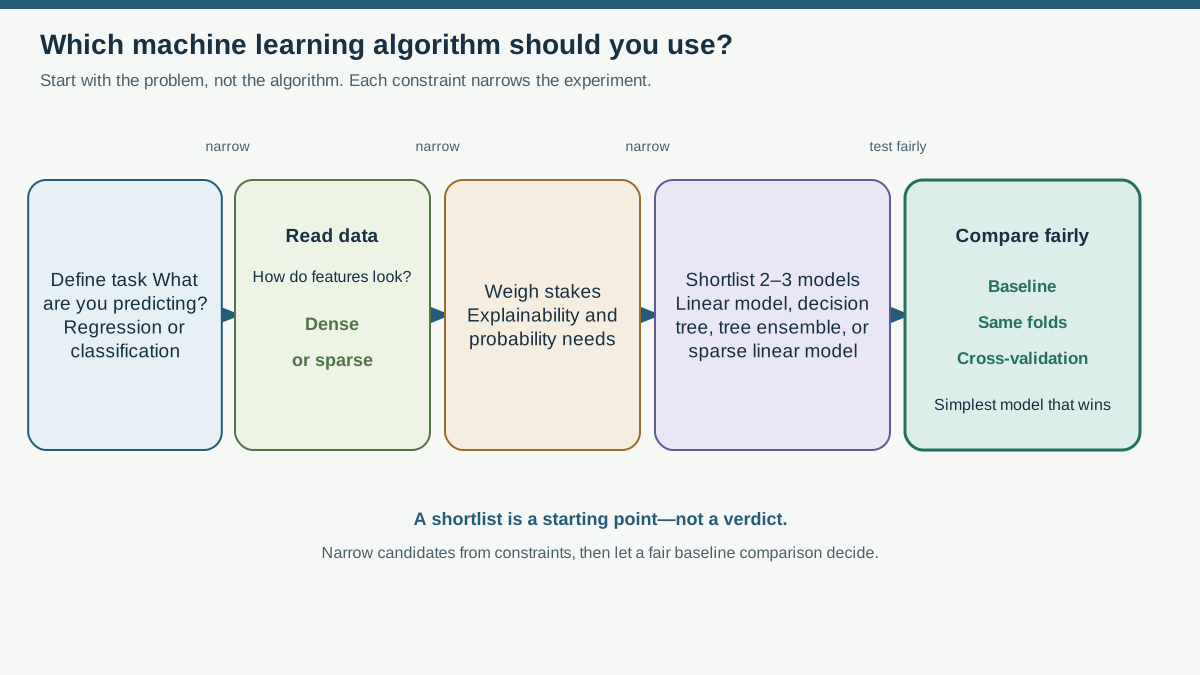
After the narrowing steps, most tabular problems land in one of two places: ordinary dense data or high-dimensional sparse data. That fork changes your first candidates.
For ordinary dense tabular data—a few dozen to a few thousand features, mostly nonzero values—your starter set looks like this:
| Candidate | What it assumes | When it shines | When it struggles |
|---|---|---|---|
| Linear regression or logistic regression | A straight-line (or log-odds) relationship between features and target | Small data, when you need interpretability, as a sanity-check baseline | Strong nonlinear patterns, many interacting features |
| Regularized linear model (ridge, lasso, or elastic net) | Same linear structure, plus some features should shrink toward zero | Many features, possible irrelevant features, multicollinearity | Strong nonlinear patterns that no linear model can capture |
| Single decision tree | The data can be split by a sequence of feature thresholds | When you need a visible, explainable rule | Complex patterns that require deep trees, which overfit easily |
| Tree ensemble (random forest or gradient boosting) | The signal is complex, interactive, and benefits from combining many trees | Tabular data with nonlinear structure and enough samples to support it | Very small data, when you need to explain individual predictions |
For high-dimensional sparse data—text represented as word counts, or user-item interaction matrices with mostly zeros—start with a linear model that handles sparsity well, such as logistic regression with regularization. Tree-based models can work on sparse data, but they often require dense preprocessing and can become slow or unwieldy. The sparse linear path is simpler, faster, and frequently strong enough.
Why include a linear baseline at all? Because it keeps you honest. If a random forest cannot beat a well-built linear model by a meaningful margin, then your problem may not need that complexity—and your effort is better spent on features or data quality than on a fancier algorithm.
Let the experiment decide: baseline first
You have your shortlist. Now the experiment earns its keep.
Start with a naive baseline—a simple prediction rule like always predicting the mean for regression or the most common class for classification. If you have not built baselines before, that step matters more than any algorithm choice. The baseline sets the floor: any model that cannot beat it is not earning its complexity.
Then compare each candidate against that baseline using the same evaluation design. Use cross-validation so every model is judged on the same folds, rather than on one lucky split of the data. If you judge models on different splits, you are comparing luck as much as skill.
One important caveat: a fair experiment means the validation design matches how new data will actually arrive. Ordinary random folds make sense when future cases are comparable to randomly held-out cases. If your data has groups, time dependence, or other structure, the validation scheme must respect that boundary—otherwise your "fair" comparison is quietly optimistic.
Two rules keep this honest:
- Never let the test set steer your choice. The test set is for final evaluation, not for deciding between candidates. If you peek at test performance while choosing, the test set stops being an honest measure.
- Pick the simplest candidate whose measured gain over the baseline is real and worth its complexity. A 0.5 percent improvement from a random forest over a linear model may not justify the loss of interpretability and the added maintenance cost.
The first comparison rarely ends the story. It starts the iteration. But it gives you something invaluable: evidence instead of guesses.
Knowledge check
Check your understanding
Answer this question before you continue.
Common mistakes when picking an algorithm
These failure modes show up constantly. Recognize them, and you will save yourself weeks of confusion.
Choosing by popularity. Picking a model because a tutorial used it, or because it tops a leaderboard, ignores everything about your specific problem. Popularity is not evidence.
Skipping the baseline. A complex model that scores 85 percent accuracy sounds great—until the baseline that always predicts the majority class scores 84 percent. Without a baseline, you cannot tell whether your model learned anything real.
Judging candidates on the test set or a single split. Both leak information and inflate your confidence. Use cross-validation for model choice, and keep the test set in reserve.
Assuming more complexity is always better. With small data or weak signal, a flexible model will happily memorize noise. Complexity must earn its place.
Treating the shortlist as exhaustive. These are starting candidates, not the complete universe of possibilities. If all of them fail, that is information—it points toward better features, more data, or a different problem framing.
Your next move
Turn this guide into a small experiment. Take one tabular dataset you care about and write down four things before you run any code:
- The task: regression or classification?
- The sample size, feature count, and whether the data is dense or sparse.
- Whether you need to explain individual predictions.
- Your two or three candidate models, chosen from the constraints above.
Then build your baseline, run a cross-validated comparison of your candidates, and look at the results with honest eyes.
The algorithm is a candidate to test, not a champion to crown in advance. The disciplined workflow—name the task, read the data, weigh the stakes, narrow the field, and let a fair experiment decide—is what produces a defensible choice. The model name is just where that process lands.
Knowledge check
Final check
Finish the article by checking the ideas you just learned.
References
Research updated Sep 8, 2026


