
Prediction Intervals for Regression: Put Uncertainty Around a Number
A regression model hands you one number. The person acting on that number needs to know how much weight it can bear. A prediction interval is how you show…

Key topics
A regression model hands you one number. The person acting on that number needs to know how much weight it can bear. A prediction interval is how you show them.
Why a Single Number Is Not Enough
Imagine you run a small online store and need to decide how much inventory to stock for next month. Your demand model says: 500 units. That number feels precise. It is not.
The true outcome is not a single value waiting to be discovered. It is a draw from a distribution of plausible outcomes centered somewhere near your estimate. That spread comes from two places: your model is an imperfect approximation of the real relationship, and the world itself carries irreducible noise. Even a perfect model cannot eliminate the second source, because the data-generating process is not deterministic.
So what does 500 units actually buy you? If the plausible range is 480 to 520, stocking 520 is cheap insurance. If the range is 350 to 650, the same decision could mean tying up cash in unsold inventory or losing sales to stockouts. The point prediction did not change. The decision did.
This is the gap that average error metrics leave open. Mean absolute error and root mean squared error describe how wrong your model is on average across many predictions. They tell you something about the typical miss. They do not tell you the range for this specific outcome, at this specific input, given what the model does not know.
A prediction interval for regression puts a boundary around that uncertainty. It answers a different question than the metrics you already track: not "how bad is my model in general?" but "where is this next outcome likely to land?"
Knowledge check
Check your understanding
Answer this question before you continue.
Prediction Interval vs Confidence Interval: Two Different Questions
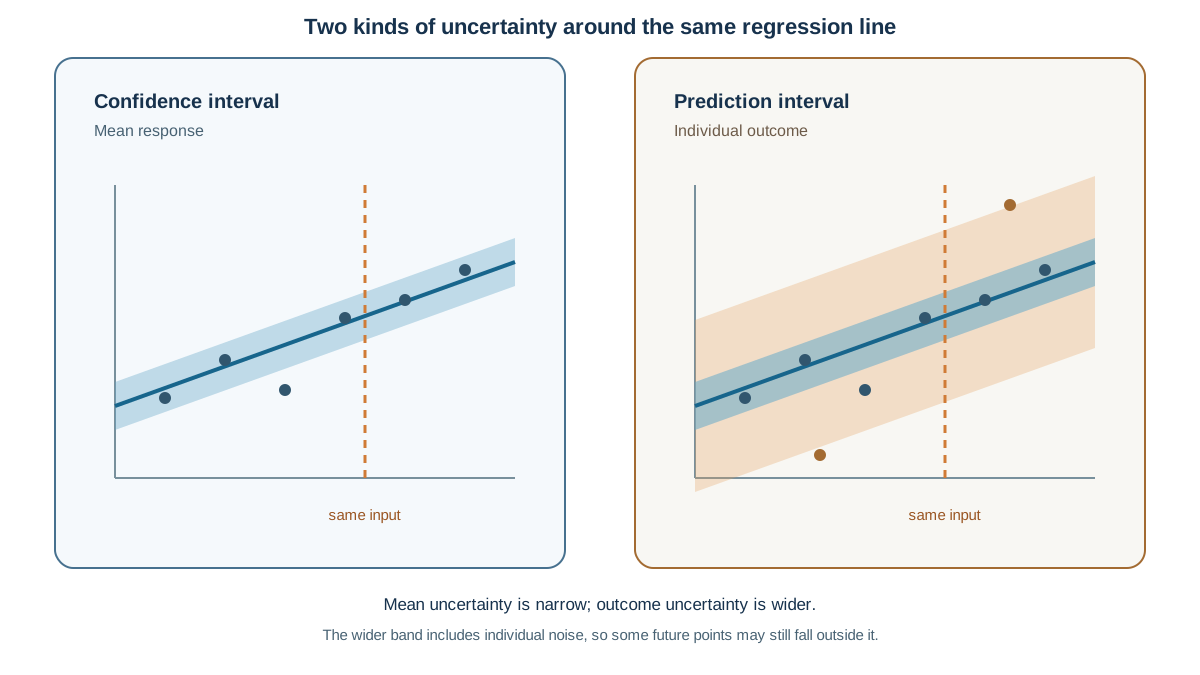
The most common confusion in regression uncertainty is mixing up two intervals that sound alike and mean different things.
A confidence interval describes uncertainty about a population parameter. In regression, that usually means the mean response at a given value of x. If you fit a line to predict house prices from square footage, a confidence interval at 2,000 square feet says something like: "We are 95% confident the average price for all houses of this size falls in this range."
A prediction interval describes where a single future observation will land. Not the average of many houses. One specific house that someone will buy next Tuesday.
That distinction matters because a single observation has to absorb more uncertainty. The average price of 2,000-square-foot houses is a stable quantity; individual houses scatter around it. Some have renovated kitchens. Some back onto a highway. Some were priced by an optimistic seller.
So the prediction interval must include both kinds of spread: the uncertainty about where the mean sits, and the noise of individual outcomes around that mean. That is why the prediction interval is always wider. Sometimes dramatically so.
Here is the plain-language version I keep in my head: the confidence interval is about the line. The prediction interval is about the next point that lands near the line. If you are reporting a forecast to someone who will act on it, they almost always need the prediction interval, because they are not betting on the average. They are betting on one outcome.
Knowledge check
Check your understanding
Answer this question before you continue.
Coverage: What the Percentage Actually Promises
A 90% prediction interval sounds like a guarantee. It is not. It is a long-run promise.
Coverage means: if you made many predictions under the same conditions and recorded the true outcome each time, about 90% of those outcomes would fall inside their intervals. For any single prediction, the interval either contains the outcome or it does not. The percentage describes the procedure, not the individual case.
That may sound like a letdown. It is actually the most useful property of prediction intervals, because it is testable.
You can measure empirical coverage on a held-out set. Take your test data, generate the lower and upper bounds for each prediction, then count the fraction of true outcomes that fall between them. If you built a 90% interval and only 70% of test points land inside, your interval is lying. It is too narrow, and the percentage on the label does not match reality.
This is what makes a prediction interval more honest than a bare point prediction. A point prediction gives you no way to check whether the model's confidence is justified. An interval with a coverage claim gives you a number you can verify against data. When the coverage falls short, you have learned something real about your model.
Knowledge check
Check your understanding
Answer this question before you continue.
Where the Interval Comes From
There is no single universal method for building prediction intervals in regression. The right approach depends on your model and your tolerance for assumptions.
For simple linear regression, you can derive closed-form bounds. The formula widens the interval as you move away from the center of your training data, because the model's estimate of the mean is less certain at the edges of what it has seen. This is the analytic case: clean, exact under the model's assumptions, and limited to models simple enough to support the math.
For more flexible models, you have options that trade assumptions for generality. Quantile regression trains separate models for the lower and upper bounds directly. Fit one model for the 5th percentile and another for the 95th, and the space between them is a 90% interval. This approach adapts naturally when the spread of outcomes changes across the input range.
Residual-based methods take a simpler path: estimate the typical spread of errors and add a band around each prediction. They are easy to implement and easy to understand, but they inherit whatever structure the residuals carry. If the error spread is not constant, a single band width will be wrong in parts of the input space.
Conformal prediction takes a different stance entirely. It is distribution-free and makes coverage guarantees under mild assumptions by using holdout data to calibrate interval width. The tradeoff is that intervals can be conservative, and the method needs enough held-out data to calibrate reliably.
The practical takeaway: fancier methods can adapt interval width to each input, but every approach depends on how well your model captures the true error structure. The method is not a cure for a model that is missing real signal.
Knowledge check
Check your understanding
Answer this question before you continue.
When Intervals Lie: Assumptions That Break Coverage
Prediction intervals come with fine print, and the fine print matters more than the method you choose.
Most intervals assume the error spread is roughly constant across the input range. When that assumption fails, you have heteroscedasticity: the noise grows or shrinks as x changes. A model predicting sales might have tight intervals for low-volume products and wide intervals for high-volume ones. If your interval assumes one band width everywhere, it will be too narrow in the noisy regions and too wide in the quiet ones.
The deeper problem is when the model misses real structure. If your regression ignores a nonlinear relationship or an important feature, the residuals carry signal, not just noise. An interval built from those residuals will underestimate true uncertainty, because it treats systematic error as if it were random scatter.
This connects directly to residual analysis. If you have already looked at residual plots and seen patterns, funnels, or curvature, those patterns are early evidence that your interval widths are not trustworthy. The interval is only as good as the error model underneath it.
Real-world intervals are often too narrow for a simpler reason: they ignore sources of uncertainty beyond the fitted noise. Distribution shift, model choice, and changes in the data-generating process all add uncertainty that the interval math cannot see. A 95% interval computed on training data can deliver far lower coverage in production, not because the formula is wrong, but because the world moved.
When to Use an Interval Instead of a Point
Prediction intervals cost extra work. They are worth it when a wrong guess has asymmetric or expensive consequences.
Use an interval when the decision changes based on how confident you are. Inventory planning, pricing, capacity sizing, and safety margins all have this shape. The cost of being wrong is not symmetric, and the width of plausible outcomes determines how much slack you need to build in.
A point prediction may be enough when the decision is insensitive to the spread. If you only need the average outcome over many cases, or if the cost of error is roughly the same in both directions, the extra uncertainty information may not change what you do.
My rule is simple: if the person receiving the number would change their action based on how confident you are, give them the interval. The interval is a communication tool. It tells a stakeholder how much slack to build into a plan, and it forces the conversation about risk into the open.
A point prediction invites false certainty. An interval invites a better question: what are we willing to bet, and what happens if we lose?
Check the Coverage
The next time you build a regression model, do not stop at the point predictions. Add an interval, then measure its empirical coverage on a held-out set. If the coverage falls short of the label, treat that as a diagnostic signal, not a failure. It is telling you that your error model is missing something, and the natural next step is to look at your residuals for the structure the interval did not capture.
Knowledge check
Final check
Finish the article by checking the ideas you just learned.
References
Research updated Sep 8, 2026


