
Why the Best Validation Score Is Often Too Optimistic
You run a grid search. The leaderboard prints a winner at 0.91. You ship it, and the first honest measurement lands near 0.86. Nothing broke. The model did…

Key topics
You run a grid search. The leaderboard prints a winner at 0.91. You ship it, and the first honest measurement lands near 0.86. Nothing broke. The model did not degrade overnight. The number was never a measurement of your model — it was the maximum of a noisy set, and maxima run high.
The Score You Report Is a Maximum, Not an Average
Beginners collapse two different quantities into one. The first is the score of a specific candidate: train this configuration, evaluate it, read the number. The second is the score of the candidate that won a comparison: run many configurations, sort the results, and report the top of the list.
Those are not the same random variable. The first is a measurement. The second is the output of a selection operator applied to a set of measurements.
Selection is an operation on numbers. If you hand me twenty estimates and ask for the best, I return the maximum. The maximum of a set behaves differently from any single member of that set — it leans upward, and it leans harder as the set grows. That lean is what we call selection-induced optimism, and it is the specific failure this article is about.
To be precise about scope: this is not data leakage. It is not distribution shift. It is not the mechanics of nested cross-validation. You already know validation data must stay separate from training data. The question here is narrower and sharper: what happens when the same validation data is used to choose among candidates?
Note: Leakage contaminates the estimate itself. Selection optimism is a property of taking a maximum over honest but noisy estimates. The estimates can be perfectly clean and the reported score can still be too high.
Knowledge check
Check your understanding
Answer this question before you continue.
Notation and the Assumptions Behind the Illustration
Before the arithmetic, define the symbols. I want you to be able to judge exactly how far this model generalizes.
Let there be K candidates, indexed by . Each candidate has a true generalization score — the number you would get if you could evaluate it on the entire population of future data. You never observe . You observe a validation estimate .
Model the estimate as the truth plus an error term:
where is a zero-mean error with standard deviation , and the errors are independent across candidates.
Four assumptions are doing real work here, and I want them labeled as assumptions rather than facts:
- Finite candidate set. You compared a known, countable number of configurations.
- Roughly unbiased individual estimates. Each is centered on its own . No systematic contamination.
- Comparable noise scale. Every candidate's estimate carries roughly the same .
- Independent errors. The do not move together.
The quantity you report is . The quantity you want is the true score of the selected candidate, , where .
The first assumption that breaks in practice is independence. Candidates in a real grid share folds, share features, share preprocessing. Their errors tend to move together. When that shared component is positive, comparisons become less independent and the extra-max effect shrinks relative to the independent case. How much it shrinks depends on the correlation structure, not on a single fixed factor. The direction, though, does not flip: correlated noise still pushes the maximum upward.
Knowledge check
Check your understanding
Answer this question before you continue.
Why the Maximum Drifts Upward: A Worked Example
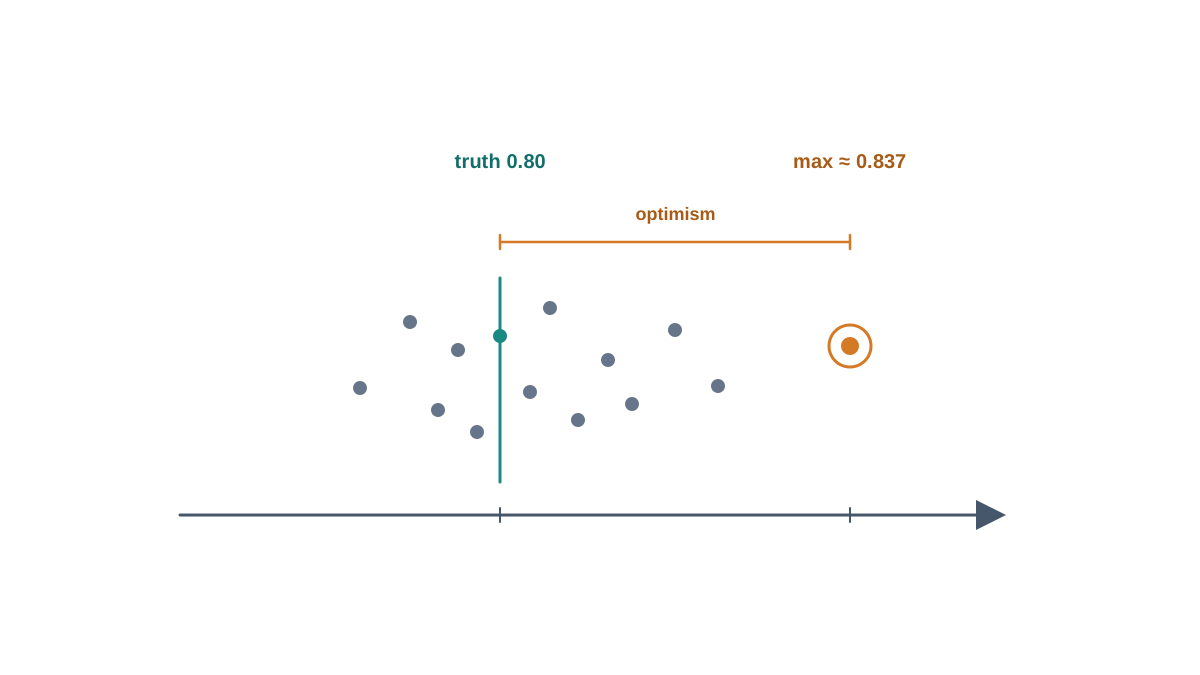
Now make it concrete. Suppose you compare candidates that are genuinely identical. Every equals the same value, say . No candidate is actually better than any other. The only thing separating them is noise.
Give each estimate a noise scale of .
If the errors are roughly normal, each is a draw from a distribution centered at 0.80 with standard deviation 0.02. Now ask: what does the maximum of twenty such draws look like?
The maximum of independent draws from a distribution sits above the mean by roughly times a factor that grows with . For twenty draws from a normal distribution, that factor is approximately 1.87. So the expected maximum is roughly:
Read that number carefully. No candidate is better than any other. The truth is 0.80 for all of them. Yet the winner's validation score lands near 0.84 — an optimism of about four points, manufactured entirely by the act of taking a maximum.
Two consequences follow immediately.
First, the gap scales with . Noisier estimates mean a larger reported score, even with the same underlying models. Small validation sets have large , which is exactly where beginners have the least data to spare.
Second, the gap scales with . Try forty candidates instead of twenty and the factor rises to about 2.07, pushing the expected maximum to roughly 0.841. The more configurations you try, the higher your reported score climbs — even when the models are indistinguishable.
Picture a dot plot: twenty points scattered around a single marked true value at 0.80, and the rightmost dot circled. The circle is your "winner." The distance from the circle to the true value is the optimism. It is not a property of the winning model. It is a property of the circle.
Knowledge check
Check your understanding
Answer this question before you continue.
What the Illustration Does and Does Not Claim
Under the stated assumptions, the example establishes one thing: the expected reported score exceeds the expected true score of the selected candidate. That is the whole claim.
It does not say the selected model is bad. Selection may still hand you the best available choice. The problem is the number attached to it, not the choice itself.
Where the assumptions fail, the magnitude changes:
- Correlated candidates shrink the effect relative to the independent case, because shared noise does not stack the same way independent noise does. The exact reduction depends on how strongly the errors move together.
- Unequal noise across candidates complicates the picture — a high-variance candidate is more likely to win by luck.
- Small validation sets inflate and therefore inflate the optimism, right where you can least afford it.
Keep this distinct from leakage. Leakage means the held-out data indirectly informed the model. Selection optimism means the held-out data honestly ranked a set of honest estimates, and you reported the top of the ranking as if it were a single measurement.
Knowledge check
Check your understanding
Answer this question before you continue.
Separated Evaluation: Paying Once for an Honest Number
The fix is structural, not statistical sleight of hand. The data used to select must not be the data used to report.
In the notation above, the bias comes from reporting when the are the same draws you used to pick . On fresh data, the selected candidate's estimate is no longer a maximum over those noise draws. The upward bias is removed, not merely reduced.
This maps onto a workflow you already have. Selection happens on validation folds. Reporting happens once, on held-out data. The held-out number is allowed to be lower than the validation winner — that is the point, not a failure.
The cost is honest: separated evaluation spends data and compute, and it gives you one number instead of a leaderboard. That is the trade. A leaderboard is a ranking tool; a held-out score is a performance claim. Confusing the two is how the 0.91 becomes a 0.86 in production.
Decision rule: Treat the winning validation score as a ranking signal, not a performance claim, whenever the same data informed the selection. The more candidates you compared and the noisier the estimate, the wider the gap you should expect between the winner and the truth.
Common Mistakes That Recreate the Bias
The theory is only useful if you can spot it in your own experiments. These patterns recreate the maximum:
- Reporting the best cross-validation score from a large grid as if it were the model's expected performance. The grid searched; the score is the search's output.
- Re-running the search after seeing the test score. This converts the test set into a selection set and reintroduces the same maximum on data you promised not to touch.
- Comparing candidates across different folds, seeds, or preprocessing steps. Extra noise gets amplified by the maximum.
- Choosing a winner from a difference smaller than the noise scale. When the gap is under and the candidates are otherwise comparable, the ranking is weak evidence — the winner may simply be the luckiest draw, not the better model.
- Treating one lucky run as progress. If the gap does not survive a change of seed or fold split, it was never a gap.
A Practical Rule for Reading Your Own Leaderboard
Before you trust a winning score, ask three questions:
- How many candidates were compared?
- How noisy is the estimate?
- Was the reporting data ever used for selection?
If the answer to the third question is yes, the number is optimistic by construction. If the candidate count is large and the noise is high, expect the gap to be wide. If the candidates are strongly correlated, expect a narrower gap than the independent-noise illustration predicts — but do not expect zero.
I would rather ship an honest 0.86 I can act on than an optimistic 0.91 I cannot. The honest number tells me where the model actually stands, which is the only place improvement can start.
Your next move: audit your last experiment. Count how many candidates you compared, and check whether the number you reported came from data that saw the selection. Then look forward to the next step in this curriculum — evaluating the entire selection procedure rather than a single chosen model, and quantifying uncertainty around the final estimate so you know how much of the gap is signal and how much is the circle.
Knowledge check
Final check
Finish the article by checking the ideas you just learned.
References
Build stronger machine learning foundations
Use structured resources to connect theory, scikit-learn workflows, and evaluation practice.


