
How Certain Is a Cross-Validation Score? Derive the Limits of Fold-Based Uncertainty
Two models. Mean cross-validation scores of 0.842 and 0.847. The instinct is immediate: the second one wins.

Key topics
Two models. Mean cross-validation scores of 0.842 and 0.847. The instinct is immediate: the second one wins.
That instinct rests on a hidden assumption — that the fold scores are independent draws, so their spread can be divided by and read as a standard error. The folds are not independent. The training sets overlap heavily. And the number you get from that division is a lower bound on your ignorance, not an estimate of it.
Let's derive where that dependence comes from, and what it does and does not license you to conclude.
What a Fold Score Actually Measures
Fix notation first, because every uncertainty claim depends on what object you are describing.
Take a dataset of observations. Split it into folds. Let be the held-out block for fold , and let be the training set — the complement of . Fit a model on , evaluate it on , and record the score:
The cross-validation estimate is the mean:
Each is a random variable. Its randomness comes from the split, from the data, and from any algorithmic randomness such as initialization or subsampling. It is not a draw from a fixed population parameter with a known sampling distribution. The mean is a summary of one particular resampling procedure — this dataset, this , this splitter — not an estimate of a single well-defined quantity whose distribution you can look up.
That distinction is the whole article. If you already know k-fold mechanics and the grouped or temporal constraints that force different splitters, hold that as background. The question here is narrower: given the fold scores you already have, what can their spread tell you?
Picture the training sets as overlapping blocks. Fold 1 trains on blocks 2 through . Fold 2 trains on blocks 1, 3, 4, …, . The shared observations are not a rounding error. They are most of the data.
Knowledge check
Check your understanding
Answer this question before you continue.
Why the Folds Are Not Independent Samples
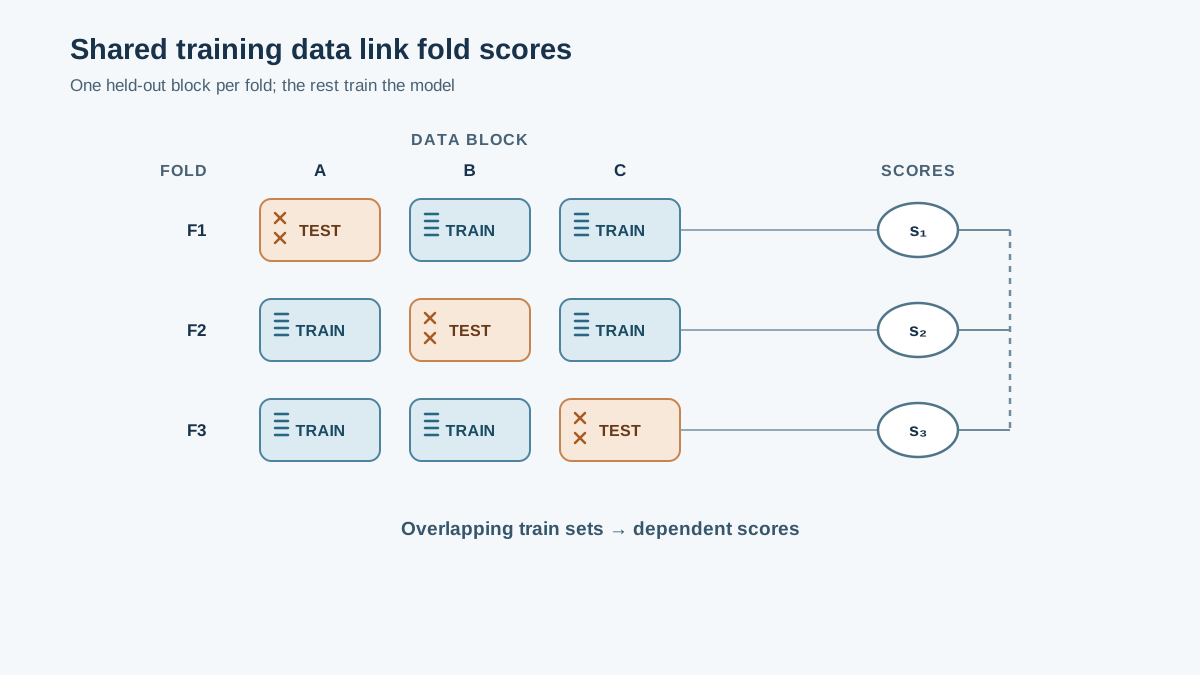
Consider two folds and . Their training sets and each contain of the blocks. They share of those blocks. The overlap fraction is:
For , that is of the training data. Two models trained on 89% identical data will make correlated errors on their respective held-out blocks. When one fold's model happens to fit the idiosyncrasies of the shared data well, the other fold's model tends to as well. The errors move together.
This correlation is not incidental. It is induced by the resampling design, and it grows as grows. Larger means more shared training data per pair, which means tighter coupling between fold scores.
There is a second dependence channel. Each observation is used for training in folds and for testing in exactly one. The fold scores are not draws from a common independent pool of errors; they are computed from a single dataset that every fold has already seen in some role.
Now state the assumption the naive formula needs. The standard error is valid when the are independent and identically distributed. That assumption is false here. Positive correlation means the effective number of independent pieces of information is smaller than — often much smaller.
Knowledge check
Check your understanding
Answer this question before you continue.
A Small Numerical Example: What the Naive Standard Error Misses
Make it concrete. Suppose you run folds and get these scores:
s = [0.81, 0.86, 0.83, 0.88, 0.79, 0.85, 0.84, 0.87, 0.82, 0.85]
The mean is . The sample standard deviation is roughly . The naive standard error is:
A naive 95% interval would be , roughly . That interval looks tight. It suggests you know the score to within about a percentage point.
The interval is too narrow. The direction of the error is always optimistic: the naive formula treats correlated numbers as independent numbers, so it divides by a denominator that is too large. The true sampling variance of is larger than the naive estimate suggests, because the fold scores carry less independent information than their count implies.
I want to be careful here. I am not going to hand you a universal correction factor. The right adjustment depends on the stability of the learning algorithm and the dependence structure of the data. A highly stable learner — one whose fitted function barely changes when you swap a few training points — produces more correlated fold scores, so the naive formula understates uncertainty more severely. An unstable learner produces noisier, less correlated scores, and the gap narrows. There is no single multiplier that fixes this across algorithms and datasets.
What the example establishes is the direction and the mechanism, not a precise number. The naive interval is a floor, not a ceiling.
Knowledge check
Check your understanding
Answer this question before you continue.
Fold Spread Is Not a Confidence Interval
This is the distinction most practitioners blur, so let's be exact.
A confidence interval needs two things: a target quantity and a coverage guarantee. The standard deviation of fold scores provides neither by itself. It answers a different question — how much did the split move the score? — not how far is the mean from the truth?
Two targets get conflated constantly. The first is the performance of the specific model fitted on the full dataset — the one you would actually ship. The second is the expected performance of the learning algorithm across hypothetical new datasets drawn from the same distribution. Ordinary cross-validation does not directly measure the first: each fold evaluates a model trained on a different subset, not the full-data model. And it estimates the second only under assumptions about how the data were generated and how the algorithm responds to training-set size. Neither target is universally "more reliable" to estimate; which one you care about determines which validation design is appropriate.
And low variance does not imply low bias. Small fold spread can coexist with a badly biased estimate — if the folds all share the same systematic flaw, they will agree with each other while all being wrong. Agreement is not accuracy.
Common mistake: Reading a tight fold spread as evidence that the mean is close to the true generalization error. The spread measures sensitivity to the split. It says nothing about whether the split itself is representative.
My rule: report fold spread as a stability diagnostic, and treat any interval built from it as a lower bound on uncertainty unless a dependence-aware method was used.
Knowledge check
Check your understanding
Answer this question before you continue.
Comparing Two Models Without Overclaiming
Back to 0.842 versus 0.847. Here is what most comparisons get wrong.
Fold scores for two models on the same splits are paired, not independent samples. Model A and Model B are evaluated on the identical held-out blocks. Comparing their means as if they were independent throws away the pairing and misstates the variance of the difference. The correct object of study is the per-fold difference , not the two means in isolation.
Even with pairing handled, a difference smaller than the fold-to-fold spread is not evidence of a real difference. It is consistent with split noise. The honest question is whether the observed gap survives resampling of the data and the split — which is why a dependence-aware test or a properly designed resampling procedure is the appropriate tool.
Practical guidance:
- Compare per-fold differences, not aggregate means, when the splits are shared.
- Watch for selection effects. Picking the best of many candidates by mean CV score inflates the winner's apparent advantage. That is a separate problem from dependence, but it compounds it.
- When the decision hinges on a small gap, treat the comparison as inconclusive until you have evidence that accounts for dependence, not just a tighter-looking number.
When This Level of Caution Is Worth the Cost
Caution should not become paralysis. Here is where I draw the line.
The naive reading is fine when the gap between candidates is large relative to fold spread, when the decision is low-stakes, or when the model will be retrained on all available data anyway. In those cases, the extra computation buys you little.
It is not fine when the decision is high-stakes, when candidates are close, when the dataset is small, or when the result feeds a claim about generalization.
Two interactions matter:
With : Larger reduces the bias of the estimate but increases fold dependence. The naive standard error becomes more misleading, not less, as you increase . This is counterintuitive and worth internalizing.
With the learning algorithm: Highly stable learners produce more correlated fold scores, so the naive formula understates uncertainty more severely. Stability is usually a virtue; here it quietly widens the gap between your reported interval and reality.
When the stakes justify it, the neighboring tools are nested evaluation for selection and bootstrap resampling for uncertainty. Both are designed to account for dependence in ways that dividing a standard deviation by does not.
What to Do With 0.842 and 0.847
Return to the opening comparison. The fold mean is a point estimate from one resampling procedure. The fold spread is a stability diagnostic. Neither is a confidence interval unless the dependence was handled explicitly.
So here is the durable rule: do not declare a winner on a gap smaller than the noise the split itself introduces.
Concretely: rerun the comparison with repeated k-fold, record the spread of the repeated means, and treat that spread as a diagnostic of split sensitivity — not as a confidence interval. Repeated k-fold scores are still dependent, because the same observations keep appearing across folds and repetitions. If the gap dissolves into the spread, you have learned something more valuable than a winner — you have learned that your data cannot distinguish these two models, and that is a finding, not a failure. If the gap survives, you still need a procedure justified for your target and assumptions before claiming a real difference.
Run the experiment. Inspect the spread. Then decide — and be honest about what the spread does and does not prove.
Knowledge check
Final check
Finish the article by checking the ideas you just learned.
References
Build stronger machine learning foundations
Use structured resources to connect theory, scikit-learn workflows, and evaluation practice.


