
Math Prerequisites for Classical Machine Learning: What to Learn First
You do not need to finish a mathematics degree before you train your first model. You need enough math to understand what the model is doing—and you can…

Key topics
You do not need to finish a mathematics degree before you train your first model. You need enough math to understand what the model is doing—and you can learn most of it after you have already built something that works.
The trap is sequencing. Beginners hear that machine learning rests on linear algebra, calculus, probability, and statistics, and conclude they must master all four before writing a single line of modeling code. So they spend months grinding through textbooks, and by the time they finish, they have forgotten why they started.
Here is the reframe: classical machine learning with scikit-learn needs a working intuition for a handful of ideas, not theorem-proving fluency. The math prerequisites for machine learning are smaller than most people fear, and they are best learned just-in-time—right before the model or evaluation step that makes them concrete.
Use this anchor criterion: learn each math idea when it explains something you are about to do. If you can train a model without it, you do not need it yet.
The Only Math Floor You Need Before Starting
Before any of the four famous areas, you need a small set of everyday math skills: variables, basic algebra, functions, and reading graphs.
That is it. If you can read an equation like y = 2x + 1, understand that x is an input and y is the output, and follow a simple line on a chart, you have enough to start. Linear models are written in this language, and loss expressions use it too. You will meet these ideas constantly, so a little comfort here prevents a lot of friction later.
Everything else can be learned alongside your modeling practice, not before it.
Knowledge check
Check your understanding
Answer this question before you continue.
Statistics First: Understanding Your Data and Your Model's Score
Statistics comes before the other math areas because it answers two questions you will face immediately: what is in my data? and is my model any good?
Start with descriptive statistics. When you load a dataset, the first thing you do is look at it. You compute the mean, median, and variance. You draw a histogram. The mean tells you the typical value. The variance and standard deviation tell you how spread out the values are. A histogram shows you the shape of that spread at a glance.
That spread matters. It is the beginning of the idea of a distribution—a description of which values are likely and which are rare. If you are predicting house prices, you need to know whether most homes cluster near $300,000 or whether the range stretches from $100,000 to $2 million. That difference changes how you interpret every prediction.
Next comes the logic of evaluation. Here is the concrete moment: you split your data into a training set and a test set, fit a model on the training set, and measure its accuracy on the test set. Why split at all? Because you want evidence of how the model performs on data it has never seen. A test split is evidence about generalization, not a guarantee that your model is good—but it is the right first tool.
Imagine you train two models and one scores 82 percent accuracy while the other scores 79 percent. Is the first model better? Not necessarily. Accuracy varies depending on which rows landed in the test set. That variation is a sampling effect: your test set is a sample of all possible data, and different samples give somewhat different scores. Without understanding this, you cannot tell whether that three-point gap is a real difference or just noise. When you want a more stable estimate, cross-validation—repeating the split-and-score process several times—is the next practical step.
For now, keep this conceptual. Hypothesis testing, p-values, and confidence intervals can wait until you need deeper evaluation. The statistics prerequisites for machine learning, at this stage, are descriptive statistics, the idea of a distribution, and the logic of held-out evaluation.
Note: "Variance" appears in two related places. Descriptive variance tells you how spread out your feature values are. Score variation tells you how much an accuracy number shifts across different test splits. Both are about spread, but one describes your data and the other describes your evaluation.
Knowledge check
Check your understanding
Answer this question before you continue.
Linear Algebra: Your Data Is a Table
Linear algebra sounds intimidating, but for classical machine learning, it is mostly about one insight: your data is a table, and that table is a matrix.
Open any dataset in pandas and you will see rows and columns. Each row is one example—one house, one customer, one email. Each column is one feature—price, age, word count. In linear algebra terms, that table is a matrix. A single row or column is a vector.
That is the mental model behind every scikit-learn dataset. When you pass a DataFrame to a model, you are handing it a matrix.
The first operation you will meet is the dot product. In a linear model, the dot product is a weighted combination of your features. Imagine predicting house prices: the model multiplies each feature—square footage, location score, age—by a learned weight, then adds them together. That weighted sum is a dot product. The weights tell you how strongly each feature pushes the prediction up or down.
One caution: do not assume a larger weight means a feature is "more important." If one feature is measured in dollars and another in years, their weights are not directly comparable. This is why feature scaling matters before you interpret coefficients.
Dot products also appear in a second place: similarity and distance calculations. Methods that compare rows—finding which customers are most alike, or which images are nearest neighbors—often use these same operations. Keep the two uses separate in your mind: one combines features into a prediction, the other measures how close two rows are.
You do not need to multiply matrices by hand. The library does that. You need to know that matrix operations are the engine underneath many classical models, and you need to recognize when a model is combining or comparing your features this way.
When does linear algebra stop being abstract? After your first models, when you start adding features, comparing distances between rows, and wondering why a model treats some inputs as more important than others. That is the moment to revisit vectors and matrices with real questions in hand.
And here is permission to skip the scary parts: eigenvalues, singular value decomposition, and projections can wait until you meet dimensionality reduction techniques like PCA. When you need them, you will know, because a model's behavior will confuse you and the explanation will point back to linear algebra.
Knowledge check
Check your understanding
Answer this question before you continue.
Calculus: Only the Idea of a Gradient
Calculus is the math area beginners fear most, and it is the one they can postpone longest for classical work.
The useful idea is not how to compute a derivative by hand. It is what a derivative means: a slope. If you change one input slightly, how much does the output change? That is the whole question.
During training, a model tries to reduce its error. It needs a direction to move—a sense of which small adjustments to its internal settings will lower the error the most. That direction is the gradient. Think of it as a compass pointing downhill on an error landscape. The model takes a step in that direction, checks the error again, and repeats. This process is called gradient-based optimization, and it is how many models learn their internal settings.
Here is the distinction beginners often miss. A model's parameters are the internal settings it learns during training. Hyperparameters are choices you make before or around training: how much to regularize, which features to include, how many neighbors to consider. When you tune hyperparameters in scikit-learn, you are running a search over different settings and comparing results—you are not usually following a gradient yourself.
So where does calculus actually show up? It becomes visible when you study linear and logistic models trained by iterative optimization, and it becomes essential when you move toward neural networks. For classical work with scikit-learn, most models hide the optimization inside .fit(). You need the concept, not the calculation.
Position calculus as the last of the four areas, and do not rush it. A conceptual grasp of the gradient will carry you far. If you later move to deep learning, you will need more calculus—which is one reason classical ML is a gentler entry point. The math load grows when you need it to grow.
Knowledge check
Check your understanding
Answer this question before you continue.
A Minimal Study Sequence That Gets You Modeling Fast
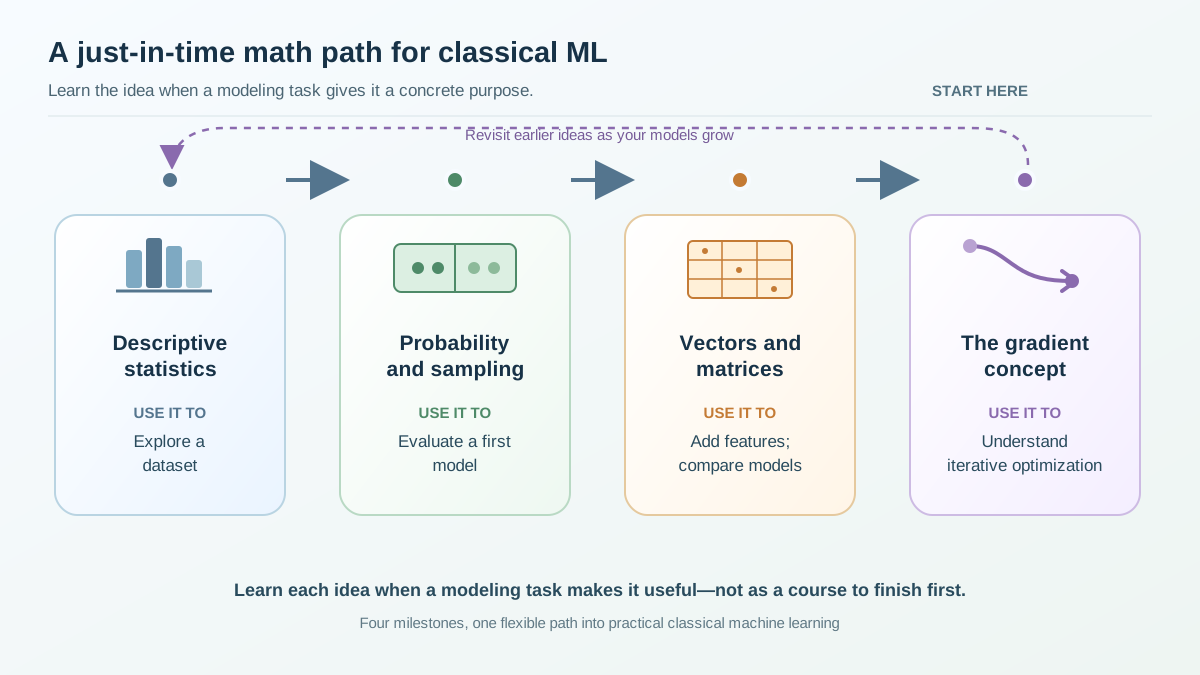
Here is an ordered plan that pairs each math idea with the modeling task it unlocks. Think of these as milestones you learn alongside your workflow, not gates you must pass before starting.
| Stage | Math idea | Task it unlocks | When to learn it |
|---|---|---|---|
| 1 | Descriptive statistics: mean, median, variance, histograms | Exploring a dataset with pandas | With your first data exploration |
| 2 | Probability intuition: distributions, sampling, uncertainty | Train/test splits and evaluating your first model | With your first model evaluation |
| 3 | Vectors and matrices: data as a table, dot products, distances | Adding features and comparing models | After a few models |
| 4 | The gradient concept: slope, direction of improvement | Understanding iterative optimization | When you study how models are trained |
Stage 1: Load a real dataset and compute its descriptive statistics. Look at the histograms. Ask what the mean and variance tell you about each feature.
Stage 2: Split the data, fit a simple linear model, and evaluate it. Notice that your accuracy number is not fixed—it shifts depending on how you split. That shift is sampling showing up in practice.
Stage 3: Add features. Compare models. When you wonder why a model treats some features as more important, or how it decides which rows are similar, you are ready for vectors and matrices.
Stage 4: When you study how a model learns—why it converges on certain settings, or what "training" actually does—the gradient concept explains what is happening under the hood.
Common mistake: Do not wait until you have "finished" statistics to start modeling. The stages above are designed to overlap. You can fit your first simple model while you are still learning descriptive statistics. The math becomes easier precisely because you have a concrete model to attach it to.
What You Can Safely Skip for Now
Anxiety about math prerequisites for machine learning usually comes from not knowing what to ignore. Here is your permission slip.
Skip theorem proofs, formal derivations, and hand computation of derivatives. You are building models, not proving theorems. The library handles the calculation; you need the intuition.
Skip eigenvalues, SVD, and advanced linear algebra until dimensionality reduction appears. When you meet PCA and feel lost, that is the signal to learn them.
Skip hypothesis testing, p-values, and Bayesian statistics until evaluation depth demands them. Comparing two models with a simple accuracy score does not require a hypothesis test. When you need to know whether a performance gap is statistically meaningful, you will have a real question that makes the topic easier to learn.
The tradeoff is simple: skipping is fine when the library handles the math. But when a model's behavior confuses you, that confusion is a signal. If you cannot explain what a model output means, that is the moment to learn the next math idea. Do not skip past confusion; let it tell you what to study next.
How to Learn the Math You Do Need
Learning math in the abstract is slow. Learning math against the backdrop of your own models is fast, because every concept has a job to do.
Learn each concept just-in-time, right before the model or evaluation step that uses it. Do not study variance in January because you might need it in March. Study it when you are staring at a histogram and wondering why the data spreads so widely.
Use your own data and models as the test bed. Run code. Inspect the output. Change one thing. Observe the effect. This loop—run, inspect, change, observe—is how builders learn, and it works for math too. A variance formula is abstract until you compute it on two different columns and see which one spreads more.
Prefer intuition-first resources over proof-heavy textbooks at this stage. You want resources that explain what a gradient does before showing you how to derive it. The derivation can come later, when you need it.
And when a concept does not click, treat that as information, not as evidence that you are "bad at math." Confusion is a signal pointing at exactly which concept to study next. It is not a verdict on your ability.
Here is your concrete next step, and it does not require finishing a single math course: pick a small dataset, compute its mean and variance, split it into training and test sets, and fit one simple model. That is the whole loop. Do that first, and learn the next math idea only when a model's behavior demands it.
Knowledge check
Final check
Finish the article by checking the ideas you just learned.
References
Research updated Sep 8, 2026


