
Choose a Classification Threshold With a Cost-Based Scikit-Learn Experiment
A model with a respectable AUC can still make the wrong decision every single day. The scores are fine. The cutoff is the problem.

Key topics
A model with a respectable AUC can still make the wrong decision every single day. The scores are fine. The cutoff is the problem.
Here is the mental model worth installing before any code: the model ranks, the threshold decides. Your classifier produces a probability for each row. The threshold converts that probability into a label. Those are two separate jobs, and only one of them is a modeling problem. The other is a cost problem wearing a modeling costume.
If you already understand that 0.5 is just a default, you are past the prerequisite. What you probably do not have yet is a procedure — a repeatable experiment that turns a cost statement into an operating point, and a protocol that keeps the final test set sealed until the threshold is frozen. That is what we are building.
Why 0.5 Is a Default, Not a Decision
The default threshold of 0.5 quietly assumes two things: that a false positive and a false negative cost the same, and that the classes are roughly balanced. In real problems, both assumptions usually fail. A missed fraud case and a false fraud alert do not cost the same. A missed tumor and an unnecessary biopsy do not cost the same. When the costs diverge, 0.5 is not a neutral choice — it is an unexamined one.
So the real question behind "what threshold should I use?" is not a modeling question at all. It is: what does each mistake cost me, and how often does each class actually occur?
The failure mode this article prevents is specific and common. You plot a metric curve, eyeball the best-looking point, and report the test-set number at that point. That number is inflated, and the inflation is invisible. You have tuned on the test set without admitting it.
State the Costs Before You Touch the Data
Write the costs down first. Not in your head — on paper, in the notebook, in a config file. This is the step beginners skip, and skipping it is exactly why threshold tuning degenerates into curve-shopping.
You need two numbers in the same unit:
- C_FP — the cost of one false positive.
- C_FN — the cost of one false negative.
The unit can be dollars, minutes of review time, churn risk, or incident severity. What matters is that both costs share a unit, because the decision rule is a sum:
expected_cost(t) = FP_count(t) * C_FP + FN_count(t) * C_FN
Everything downstream is just this formula evaluated across thresholds. That is the whole engine.
Note: Costs are a business input, not a modeling output. They come from stakeholders, incident history, or a stated policy. Write them down so they can be challenged — a cost assumption nobody can argue with is a cost assumption nobody checked.
Sanity-check the ratio, not the absolute numbers. A 10:1 cost ratio drives the threshold far more than whether your unit is dollars or euros. And note the assumption you are making: this formula treats the scores as probabilities. If they are badly calibrated, the formula still ranks thresholds correctly, but the absolute expected cost is not trustworthy. We will come back to that boundary.
Knowledge check
Check your understanding
Answer this question before you continue.
Split First, Predict Once, Then Freeze the Scores
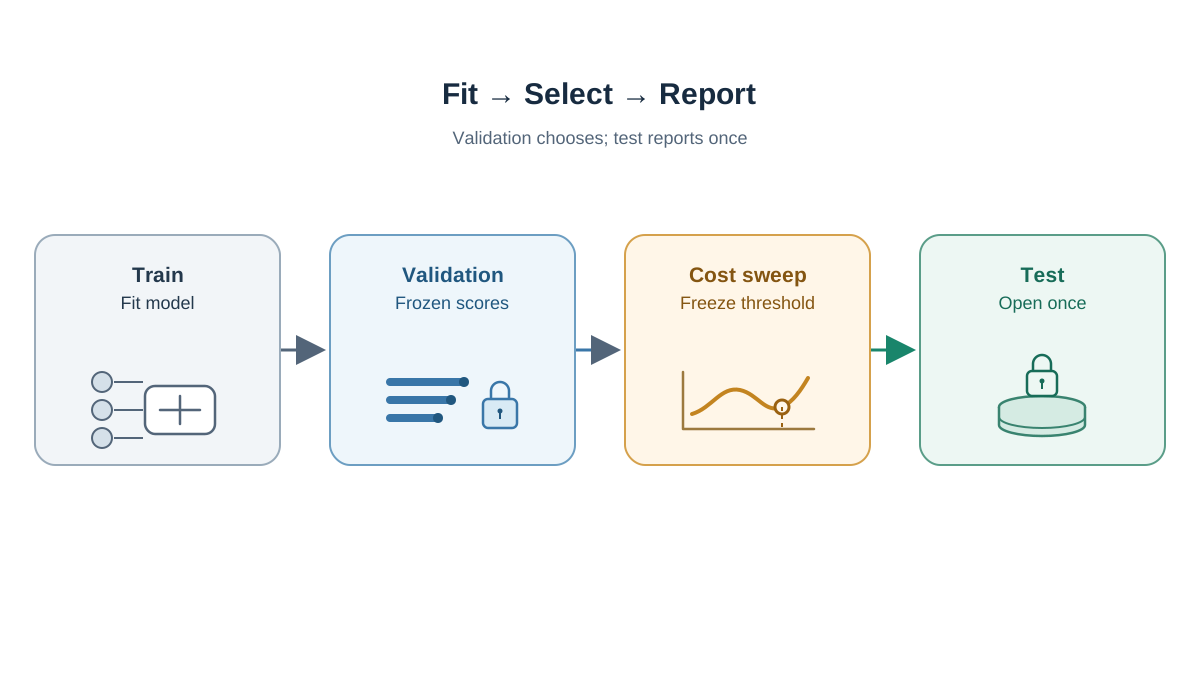
The protocol is what makes the whole exercise trustworthy. Three roles, three jobs:
| Split | Job | Rule |
|---|---|---|
| Train | Fit the model | Fit once |
| Validation | Select the threshold | Sweep freely |
| Test | Report the final number | Open exactly once |
Fit the model on train only. Then call predict_proba on validation and store the positive-class column as a fixed array. From this point on, no model is refit. If you refit or re-tune the model while sweeping thresholds, you can no longer attribute any improvement to the threshold — you have changed two things at once.
import numpy as np
import pandas as pd
from sklearn.metrics import confusion_matrix

# y_val: true labels for the validation split
# y_prob: positive-class probabilities from predict_proba(X_val)[:, 1]
# Both are frozen here. No model is refit below this line.

C_FP = 50.0   # cost of one false positive
C_FN = 500.0  # cost of one false negative
If your dataset is small, do not trust a single validation split. Use cross-validated out-of-fold predictions on the training portion instead, so the sweep is not hostage to one lucky split. The rest of the procedure is identical.
Sweep Thresholds and Read the Confusion Matrix
Now the core loop. For each threshold, convert probabilities to labels, count the four confusion-matrix outcomes, and charge the cost.
rows = []
for t in np.linspace(0.01, 0.99, 99):
    y_pred = (y_prob >= t).astype(int)
    tn, fp, fn, tp = confusion_matrix(y_val, y_pred).ravel()
    cost = fp * C_FP + fn * C_FN
    rows.append({"threshold": t, "TP": tp, "FP": fp,
                 "FN": fn, "TN": tn, "cost": cost})

sweep = pd.DataFrame(rows)
best = sweep.loc[sweep["cost"].idxmin()]
print(best)
Expected output shape — a table with one row per threshold:
threshold    0.42
TP            118
FP             37
FN             22
TN            323
cost         12850.0
Record counts, not just rates, because cost is charged per event. A false-positive rate of 3% means nothing until you multiply it by how many rows actually exist.
The mechanism the table reveals is worth naming. Raising the threshold shrinks the set of predicted positives. True positives and false positives both fall; false negatives rise. The exchange rate between those movements is set by the score distribution — not by a constant. That is why you sweep instead of solving for a single number.
Knowledge check
Check your understanding
Answer this question before you continue.
Pick the Operating Point — and Check It Is Not a Fluke
The row with minimum cost is a candidate, not automatically the answer. Inspect the cost curve before you commit.
- Flat regions are your friend. A threshold in the middle of a plateau survives small score noise. A threshold balanced on a cliff edge does not — one new data point flips the decision.
- Confirm the selected row actually has the lowest computed cost. Re-read the cost column directly. If two thresholds are within a few percent of each other, you are choosing between statistical ties, not between a winner and a loser.
- Resample to test stability. Bootstrap the validation predictions, re-run the sweep, and watch how far the optimal threshold moves. A threshold that jumps wildly across resamples is a warning, not a result.
- Compare against 0.5. Report the cost difference in the same units you started with. "This threshold saves $4,200 per 1,000 cases" is a sentence a stakeholder can act on.
Common mistake: Optimizing a rate-based metric like F1 or accuracy when the real objective is a per-event cost. Those metrics weight errors by their own internal logic, not by yours.
Freeze the Threshold, Then Open the Test Set Once
Apply the frozen threshold to the test predictions. Do not re-sweep. Do not nudge. Do not "just check" a nearby value — that is tuning on the test set with extra steps.
Report the test confusion matrix and expected cost alongside the validation numbers, so the generalization gap on the decision itself is visible. A validation-to-test gap in cost is normal. A large gap usually means the validation set was too small or the threshold was chosen on a noisy plateau.
If the test result is unacceptable, the fix is a new experiment with a new split — not a second pass on the same test set. The test set is a fire alarm. You do not test it by pulling it repeatedly.
Knowledge check
Check your understanding
Answer this question before you continue.
When Prevalence or Costs Change, the Threshold Moves
This is the part that makes the procedure durable: the threshold is a function of costs and prevalence, not a property of the model.
Rerun the sweep with a different cost ratio and watch the optimum shift. Raise C_FN relative to C_FP and the threshold drops — you would rather over-alert than miss. Raise C_FP and it climbs. The direction is predictable, and that predictability is the point.
Prevalence is subtler. If the deployment population has a different base rate than your validation set, the same score cutoff will produce a different confusion matrix — different counts of false positives and false negatives, and therefore a different total cost. The cutoff itself is a fixed number; the consequences of that cutoff are not. That is why a threshold tuned on last quarter's data is a stale decision rule. When the population shifts, reassess the operating point on representative labeled data rather than assuming the old cutoff still minimizes cost.
The practical rule: store the threshold as a configuration value with its cost assumptions attached. When either input changes — costs or prevalence — re-derive it. A threshold without its assumptions is a number nobody can defend.
Warning: This entire procedure assumes reasonably calibrated scores. If your model ranks well but its probabilities are unreliable, calibrate first, or treat the threshold as a ranking cutoff rather than a probability cutoff. The sweep still works; the cost interpretation does not.
Knowledge check
Check your understanding
Answer this question before you continue.
Common Mistakes in Threshold Experiments
Audit your own notebook against this list:
- Sweeping thresholds on the test set and reporting the best test cost.
- Refitting or re-tuning the model inside the sweep loop.
- Optimizing F1 or accuracy when the real objective is a per-event cost.
- Ignoring class prevalence when comparing thresholds across datasets or time periods.
- Treating the argmin as stable without checking the shape of the cost curve.
- Forgetting that a threshold is a deployment artifact that needs an owner and a review trigger.
The Decision Rule
Write the costs down. Freeze the validation scores. Sweep. Pick a stable point in a flat region. Open the test set once. Store the threshold with its assumptions, and re-derive it when prevalence or costs move.
That is the whole procedure, and it fits in a notebook you can run this afternoon.
The natural next step is to check whether your scores are calibrated enough for the cost formula to mean what it says. If they are not, the threshold you just derived is still a defensible ranking cutoff — but the dollar figure attached to it is fiction. Calibration is the bridge between a good ranking and a trustworthy cost.
Knowledge check
Final check
Finish the article by checking the ideas you just learned.
References
Build stronger machine learning foundations
Use structured resources to connect theory, scikit-learn workflows, and evaluation practice.


