
Machine Learning Data Preparation: From Raw Rows to Model Inputs
Your model is only as smart as the table you hand it. Most beginners skip straight to fitting an algorithm, then blame the model when results disappoint.…

Key topics
Your model is only as smart as the table you hand it. Most beginners skip straight to fitting an algorithm, then blame the model when results disappoint. The real culprit is usually upstream: the data arrived messy, and nobody gave the model a fair chance to learn.
Why Data Preparation Decides Your Model's Fate
Here is the mechanism that changes how you should think about this work: a machine learning model can only learn patterns that exist in the data you give it. It cannot invent signal that cleaning removed, fill gaps that transformation ignored, or recover from information that leakage corrupted.
That sounds obvious, but watch what it implies. If your dataset has duplicate rows, the model quietly treats repeated examples as extra evidence. If a column contains the answer you are trying to predict, the model learns to cheat. If categories are spelled inconsistently, the model sees one logical group as several unrelated ones. None of these are modeling problems. They are data problems, and no algorithm choice will fix them.
Practitioners spend most of their time here, not writing model code. That is not a detour. It is the job.
I have watched beginners blame the algorithm for weeks when the data was the real culprit. The fix is not a better model. It is a cleaner table. So separate two kinds of problems in your head: data problems like missing values, wrong types, and leakage, and modeling problems like which algorithm and which parameters. Fix data problems first. Until you do, every modeling result is suspect.
Think of the feature matrix and target as the contract you hand the model. Features are the inputs the model learns from. The target is what you want it to predict. Everything before that handoff is preparation, and the quality of that contract bounds the quality of everything after it.
Start by Looking: Know Your Table Before You Touch It
Before you transform anything, inspect what you actually have. Open your DataFrame and run basic checks: the number of rows and columns, the column names, the data types, and how many missing values each column holds. This is not busywork. Every transformation decision you make later depends on what this inspection reveals.
Early, separate your columns into two groups: features, the inputs the model will learn from, and the target, the thing you want to predict. This distinction drives every later choice. If you do not know which column is the target, you cannot evaluate whether your preparation worked.
Look for columns that only look numeric. A postal code is stored as digits, but it does not behave like a number. Postal code 20002 is not twice the quantity of postal code 10001. It is a category that happens to wear numeric clothing. The same applies to ID numbers, phone numbers, and zip codes. Recognizing these impostors now saves you from encoding mistakes later.
Also scan for obvious problems before transforming: duplicate rows, impossible values like negative ages, and columns that leak the answer. A column named "refund_amount" in a dataset where you want to predict whether a customer will request a refund is not a feature. It is the answer wearing a disguise.
Knowledge check
Check your understanding
Answer this question before you continue.
Clean the Obvious Problems First
Cleaning is where you fix what you can explain before reaching for statistical fixes. Start with duplicates. Duplicate rows quietly inflate confidence in your results because the model sees the same example multiple times and treats it as stronger evidence than it deserves. Remove them or investigate why they exist, but do not let them ride along unnoticed.
Missing values need a decision, not a default. You can drop the rows with missing values, drop the column entirely, or fill the gaps with a substitute value. The right choice depends on how much is missing and why it might be missing. If 2 percent of your rows lack one value, dropping them is usually harmless. If 60 percent of a column is empty, dropping the column may be wiser than inventing data. If the very fact that a value is missing carries meaning, such as a sensor that stopped reporting, then the missingness itself is information.
Inconsistent formatting is a quieter killer. If one row says "NY" and another says "New York," the model treats them as different categories. Fix the formatting so a single logical group does not split into several fake ones.
My rule: keep a record of what you changed and why. Preparation is a repeatable process, not a one-off scramble. When results look strange later, that record is where you start looking for the cause.
Common mistake: Filling every missing value the same way without asking whether the missingness itself means something. A blank that means "not applicable" is different from a blank that means "nobody recorded it."
Knowledge check
Check your understanding
Answer this question before you continue.
Make Every Column Speak the Model's Language
Most classical machine learning models expect numbers. Text categories, like colors or product types, must be converted before the model can use them.
For categories with no natural order, one-hot encoding is the standard approach. It creates a new column for each category and marks presence with a 1 or 0. A row that is "red" becomes red=1, blue=0, green=0. This works because it does not imply any ranking between colors.
Avoid the trap of assigning category numbers like red=1, blue=2, green=3. The model may interpret that as a meaningful order, concluding that green is somehow "more" than red. Unless your categories genuinely have an order, like small, medium, and large, keep them unordered.
Numeric features often live on wildly different scales. One column might measure income in dollars, ranging into the hundreds of thousands, while another measures age, ranging from 0 to 100. A distance-based model will let the income column dominate because its numbers are larger, even if age matters more for the prediction.
Scaling fixes this. Normalization rescales values to a fixed range, often between zero and one. Standardization centers values around the mean and scales them by their spread. Both make features comparable, and the choice between them depends on your model and data. The key insight: encoding and scaling are about making data usable, not about making it "better" in some absolute sense.
Knowledge check
Check your understanding
Answer this question before you continue.
Split Before You Transform: The Leakage Trap
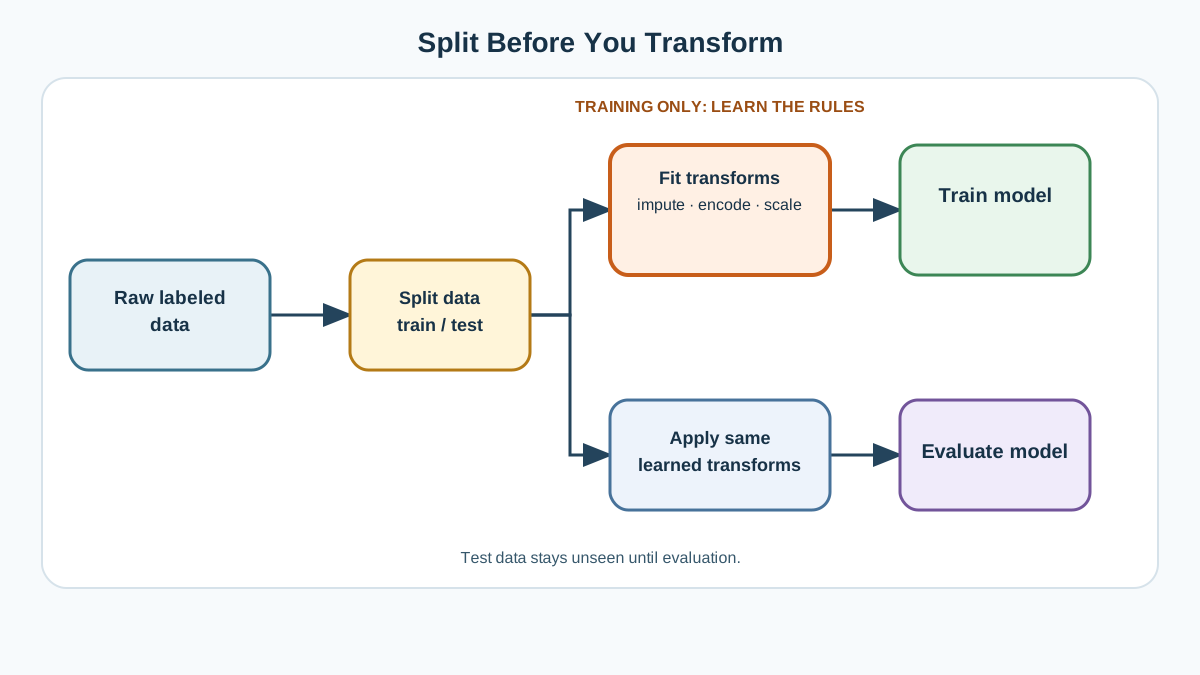
This is the most important ordering rule in machine learning data preparation, and it is the one beginners violate most often.
Leakage means information from outside your training data sneaks into the training process, making the model look better than it really is. The classic source is the test set, the portion of data you hold back to evaluate how well your model generalizes.
The rule is simple: split your data into training and test sets first. Then fit any scaling, encoding, or imputation on the training portion only. Apply the same learned transformation to the test portion.
Here is why the order matters. Suppose you scale a numeric feature using the mean and spread of the entire dataset, and only then split into training and test. The test set has quietly influenced the scaling values used on the training data. The model has seen a fingerprint of the test set before evaluation begins. Your accuracy looks great, and it is a lie.
The fix is a pipeline: a repeatable sequence that fits on training data and reuses the same learned steps on new data. You fit the scaling on training, then apply that same scaling to test. The test set never influences the transformation.
Common mistake: Transforming the whole dataset, then splitting. It looks harmless and quietly corrupts your evaluation. Split first. Transform after.
Knowledge check
Check your understanding
Answer this question before you continue.
A Repeatable Workflow, Not a One-Off Script
Pull the steps together and you get a workflow you can repeat on any dataset:
- Inspect the table: shape, types, missing values, suspicious columns.
- Separate features from the target.
- Clean obvious problems: duplicates, impossible values, inconsistent formatting.
- Split into training and test sets.
- Fit transformations on training only, then apply them to test.
The pipeline matters even before you write code because it forces the correct order. Scikit-learn pipelines let you chain preparation and modeling into one object, treating the whole flow as a single step. That means the leakage mistake cannot recur by accident. The transformation learns from training data, and the same transformation applies to whatever comes next.
Here is a decision rule I use constantly: if a model performs suspiciously well or suspiciously poorly, suspect the data before the algorithm. Suspiciously well often means leakage. Suspiciously poorly often means a cleaning mistake or a feature that should not exist. The algorithm is rarely the first place to look.
Your deliverable is a defensible feature matrix and target: a table where every column is meaningful, every value is honest, and the evaluation you run on it can be trusted. The pipeline is how you keep it honest.
Your Next Step
Take one small dataset you already have. Run the inspection checks: shape, column types, missing values. Write down which columns are features, which is the target, and what cleaning each column needs. You will likely discover that the exercise itself clarifies more than any tutorial could.
When a model result looks wrong later, remember the rule: go back to the data, not to a different algorithm. The data is where the answers hide, and preparation is how you find them.
Knowledge check
Final check
Finish the article by checking the ideas you just learned.
References
Research updated Sep 8, 2026


